.svg)
.svg)
Heatmaps for SEO: How Do They Uncover Insights?
Learn How Implementing SEO Heatmap Google Analytics can Boost your Sales

Heatmaps are a powerful tool for SEO professionals. They provide valuable insights into user behavior and engagement on a website, helping to uncover what works and what doesn't. Heatmapping allow you to track user interactions such as clicks, scrolls, and mouse movements, giving you valuable insight into how users interact with your website and what elements need improvement.
Using heatmap for SEO and on-page optimization can uncover insights that can help you improve your website content, increase page views, and ultimately, close your leads and increase conversions. With the right strategies, heatmaps can be valuable in discovering user needs and uncovering SEO opportunities.
Using heatmaps for SEO will allow you to uncover valuable insights and make informed SEO decisions.
Table of Contents
8.
10.
Website Heatmaps Defined
Heatmaps are visual representations of user activity. Heatmaps provide a visual chart using warm colors to indicate where visitors are clicking on a page most. Darker colors, such as red and orange, typically indicate areas with a higher concentration of clicks, while lighter colors, such as blue and green, indicate fewer clicks.
Web admins use it as an analytical tool to gain crucial insights and optimize website performance. Heatmaps can show the frequency of user clicks and mouse movements on different page areas, movement patterns throughout the site, navigation pathways, and other metrics.
These heatmap visualizations allow websites to identify popular or unpopular areas, how often or rarely a feature is used, and how users interact with the page. You can use heatmap data to make informed changes and optimize the website for better user interaction.

Here are some ways you can utilize heatmaps on your website:
1. Uncover areas of interest on your page and discover user behavior patterns.
2. Identify navigation problems & pinpoint areas of friction.
3. Highlight successful page elements & validate design changes or variations.
4. Optimize ad placement and guide your content optimization efforts.
Types of SEO Heatmap
Heatmapping tools collect and color-code information about how users interact with a website. They track and analyze user interactions with the website or app and then aggregate that data into a visual format. For instance, if someone looks at or clicks on a particular box on the website, the google analytics heatmap will record it. The color changes when that place is touched more frequently. Reds and oranges typically symbolize the "hottest" locations or regions with the most activity on the page.
There are five types of heatmaps for SEO.
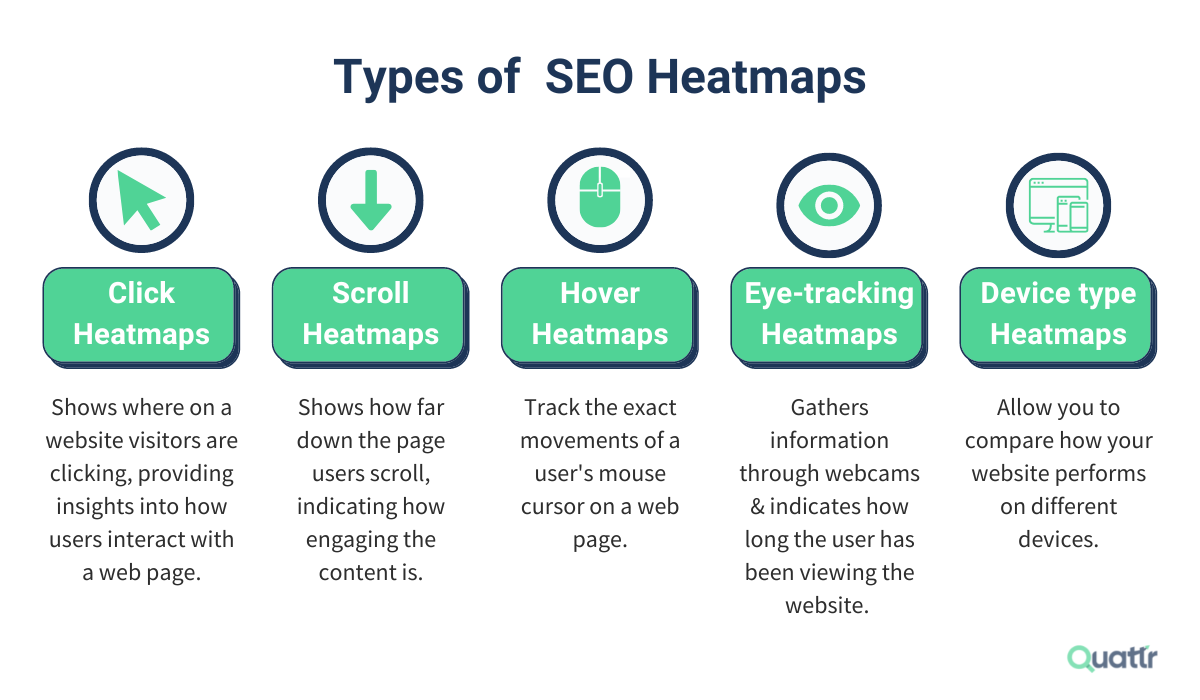
1. Click Heatmap: Click heatmap shows where on a website visitors are clicking, providing insights into how users interact with a web page.
2. Scroll Heatmap: Scroll heatmap shows how far down the page users scroll, indicating how engaging the content is.
3. Mouse Movement/Hover Heatmap: Mouse movement heatmaps track the exact movements of a user's mouse cursor on a web page, showing areas that may need improvement or clarification.
4. Eye Tracking Heatmap: Eye tracking heatmap is a more comprehensive map view that gathers information through webcams, which track the user's eye movement while on the site. The map indicates how long the user has been viewing the website. It can be beneficial to identify customer desires for a product or service.
According to experts, people spend more time on the left side of the site. Thus it should be utilized to display a logo, banner, and other essential information.
5. Desktop & Mobile Heatmap: Desktop and mobile heat maps allow you to compare how your website performs on different devices. For example, the main content on a desktop website may be considerably lower down the page compared to a mobile device. Device-type heatmaps can help guide your design efforts across devices.
Why is SEO Heatmapping Important?
Heatmapping is a valuable tool for understanding how visitors interact with a website and what areas of the page perform best. By tracking the user experience with a heatmap, website owners can identify areas of a page where potential visitors are getting stuck or where they are most engaged.
The information gathered from a heatmap visualization chart can help users find what they're looking for more efficiently and improve their experience. By tracking how users interact with a website, website owners can identify the areas of the page that are most engaging and can use this information to tailor their content and design.
You can also use Google Analytics heatmaps to track the performance of online marketing campaigns, such as the effectiveness of pay-per-click advertising. Once you know what elements of your ad are working, you can use the information to make changes and optimize your campaigns for lower costs and higher success rates.
By optimizing the user experience with SEO heatmaps, website owners can improve their website's SERP rankings, increasing their visibility and online presence.
Benefits of Website Heatmap
Heatmap for SEO is an invaluable tool for understanding and improving user experiences on a website. Heatmaps provide valuable insights into website engagement, allowing website owners to identify areas for improvement or optimization. Some key benefits of using heatmap for SEO include:
1. Identifying Engagement Patterns: Heatmaps can remember how users engage with a website and where users spend the most time on a page or click patterns. You can also quickly determine what content works best on your pages. SEO heatmaps can guide your content optimization efforts and ensure you generate valuable content for your users.
2. Improve User Experience by Identifying Areas of Improvement: Heatmapping enables you to identify areas of your website that need improvement to enhance the user experience. By understanding user engagement patterns, website owners can identify areas of confusion or where users may need help. They can then make changes to the website's design, layout, or functionality based on the heatmap feedback.
3. Improving Conversion Rates: Heatmaps allow website owners to identify which headlines, images, and calls-to-action have the most impact and drive the most conversions. Thus, web designers can tweak and optimize the design for conversions.
4. Improved Website Navigation: Heatmaps help website owners know the users' website navigation by showing where users click, scroll, and hover. By understanding user behavior on the website, businesses can optimize content and navigation structure to suit their customers better and increase engagement.
Heatmap & SEO
As of now, you must have understood why a website heatmap is vital for your company. But to get the most out of it, you must utilize your heatmap with SEO. Heatmapping and SEO can help marketers and website owners understand user behavior and enhance their SEO efforts.
The correlation between heatmaps and SEO is crucial for optimizing a website for search engine performance and user experience. Heatmaps are visual representations of user activity on a webpage and can highlight areas of user engagement and how users interact with a website. Search engines use this information to help determine search engine rankings and user experience.
Heatmaps visually represent where website visitors click and how they move their cursor. Knowing how customers interact with a website can help marketers identify where they should focus their SEO efforts.
Heatmaps are also valuable in identifying navigation issues, technical difficulties, and other areas of the website that need improvement. Heatmapping is a valuable tool in optimizing a website for SEO performance. By understanding how users interact with the website, website owners can better optimize it for SEO performance, leading to better search engine rankings and user experience.
7 Ways Heatmap Can Help Boost Your SEO Efforts

Let's take a look at how heatmap can help you boost your website's SEO:
1. Prioritized Content Optimization: Heatmaps can help you determine which pages bring in the most traffic and which pages need content optimization. You can then optimize your content to target the right keyword clusters.
2. Improve Website Navigation: Heatmaps can help determine where people click on your page. They also help inform if website navigation improvements like breadcrumbs or faceted search are improving user experience.
3. Test Link Placement & Performance: Heatmaps can help you determine which external links perform best and which need adjusting for better ranking. Heatmapping can also track clicks on certain links, providing an understanding of whether your internal linking strategy is working or not. Heatmaps also allow you to test and refine link placement, helping you to optimize internal link structure and prioritize which pages to link the most.
4. Optimize for User Search Intents: Is a particular section on a page receiving multiple clicks? Heatmaps can help to identify user search intent by visually displaying patterns in user behavior and interactions with a website.
5. Provide the Best User Experience: The ultimate goal of using Google analytics heatmaps is to improve your website's page experience for your target users. Heatmaps data can help guide your A/B testing for page design or website optimization. Ensure you align heatmap data with business goals and give your users the best page experience.
6. Optimize Your Meta Title Tags: Google Analytics Heatmaps can help you understand which content on your website is getting the most attention from users. Analyzing this data lets you sync your meta titles to reflect your website's most relevant and valuable content. This minor tweak can bring significant long-term benefits and help you stand out.
7. Enhance Website for Buying Process: Your website should guide visitors to related content based on their stage in the buying process to increase the chances of visitors purchasing, signing up, or subscribing. Your website's hyperlinks should work together to provide visitors with what they need at each buyer journey stage.
To ensure visitors click on the most relevant content, you can use click heatmaps to see which links they click on. Clicking on the links should take visitors away from the current page, ensuring that the links embedded in your content are relevant and assist the user journey.
Use Cases of Google Analytics Heatmap in E-commerce
Google Analytics heatmap is a powerful tool to analyze the behavior of visitors and optimize e-commerce websites. Here are some specific use cases of Google Analytics heatmap in e-commerce:
1. Product Pages: E-commerce websites can use Google Analytics heatmaps to analyze which product pages get the most engagement. It can help businesses understand which products are most popular with their customers and which need more attention.
2. Checkout Process: Heatmapping can help e-commerce businesses understand which parts of the checkout process is causing visitors to drop off. Companies can optimize their checkout process to increase conversions by identifying the areas that need improvement.
3. Search Results: By analyzing the heatmap of the search results page, businesses can understand which search results are most relevant to their customers. It can help companies to improve their search algorithms and provide more relevant search results to their customers.
Tools for Heatmapping
Various tools are available to track and find the heatmap visual data for your website. One free tool is Google Analytics Heatmap.
Web developers and admins can use it along with Google Analytics to know how users are interacting with your website and can make customized changes. To configure Google Analytics Heatmap, follow the instructions below:
Note: Google's heat map Chrome extension was deprecated in 2019. While Google is not updating it, it still works.
Step 1: Set up your Google Analytics Account
The only condition to use the Page Analytics plugin is that you should already have a Google Analytics (GA) account. You should use the same website/URL registered in GA to use the plugin.
Step 2: Install the Page Analytics Extension in Chrome:
Head to the chrome extension marketplace and download the Page Analytics plugin. You will be able to see the plugin on your Chrome toolbar. Log in using your GA credentials. You will see a green tick if the login is successful.
Google Analytics will provide all the data required to create a click map. You now have a click map for each website page in your browser and are ready to analyze your website and user behavior.
After installing the plugin, you can load a page you are tracking with a Google Analytics overlay and see the following information:
1. Metrics: Pageviews, Unique Pageviews, Average Time on Page, Bounce Rate
2. The number of Active Visitors
3. Real-time in-page click analysis (where users click on that page)
Step 3: Build Custom Google Analytics Heatmap Reports
Page Analytics Chrome extension allows you to build and save custom reports. Let us understand what else is on the Google Analytics bar and how you can utilize it.
1. Date or Time Range: You can use this to view your data in intervals, such as by day, week, or month. You can also pick time intervals, like hours of the day.
2. Bubble Icon: Click on the bubble icon to see the percentage of users who have clicked on each page element. Click on each component to see the number of user clicks within the selected time range.
3. Color Icon: Use this to customize the heatmap colors based on your data and quickly identify trends.
4. Click Threshold: A filter lets you specify the minimum number of clicks an element should have to display on the heatmap. You can use this in combination with the bubble icon to know what elements received clicks within the threshold range specified.
5. Segments: This allows you to segment and filter your data by visitor types and demographic information. You can select up to 4 components.
6. Real-time or All-time Data: You can view the data in real-time or all-time to get an overview of your visitors' behavior.
With the parameters in place, the Page Analytics add-on creates a Google Analytics Heatmap that visualizes click data on various web pages in real-time. You can see the data only through colors, a little bubble indicating percentages, or both.
You have successfully created a Google Analytics Heatmap to monitor your website/URL performance.
You can also use Heatmap Layer in Google Analytics to receive client-side rendering heatmap. The Google Analytics Heatmap Layer is more comprehensive as it provides a broader range of data points, including traffic data, conversions, and user behavior. Learn more about the steps to use Heatmap Layer in Google Analytics here.
Paid Heatmapping Tools
As pointed out, Google will not update its free heatmap extension. While it is a good resource for beginners, if you want to dig deeper into heatmap analytics, you should invest in a paid tool.
There are other paid heatmap tools available in the market. Some of them are
1. Crazyegg: Crazyegg is an online application that analyzes specific pages on your website, showing where visitors clicked and on which section of the screen.
2. Mouseflow: Mouseflow is a dynamic tool that assesses your website's performance at both the macro and micro levels, taking heatmaps to the next level.
3. Hotjar: Hotjar is helpful for basic user behavior assessments since it displays all the heatmaps in one location and summarizes the various heatmaps created.
4. Lucky Orange: Lucky Orange distinguishes itself from other applications by integrating specific built-in data analytics tools for organizing heatmaps in easy-to-read numerical formats.
Optimizing Conversions with Heatmap SEO
When you first start using heatmaps, it can take time to understand the data they provide. However, by analyzing the data, you can discover valuable insights that can help improve your website content and increase page views.
Before we dig deeper into what data points you can find using your website's heatmap, let us understand how to read a heatmap.
How to Read your Google Analytics Heatmap Data?
A Google Analytics heatmap uses color-coded cells to identify trends and patterns in your data. It can identify areas of your data that need further exploration quickly.
To understand a heatmap, first look at the range of colors used. Heatmap data is represented graphically, with colors indicating the frequency and intensity of user interaction. Generally, warm colors (red, orange, yellow) indicate higher user interaction. The cool colors (blue, purple, green) show a lower value. Different SEO heatmaps may use a different color palette, so check the legend to understand the meaning of each color.
When looking at your website's heat maps, there are several vital elements to consider. First, you should look at the placement of the heatmap. Where does it appear on the page? Are there high concentration points? If so, these areas are likely of more interest to the user, and you should focus more on them.
Second, you'll want to consider the types of activity represented on the heatmap. Are users clicking, hovering, or scrolling? Activity behavior can offer insight into what page elements are receiving the most attention and should be further optimized.
You will also want to examine the frequency of user activity. On a particular page, are there more clicks than hovers? Are users scrolling down multiple times? These patterns can reveal how much time users spend on a specific page and what elements they engage with most.
Finally, it's important to remember that website heatmaps are just one visualization tool. Combining the insights a heatmap provides with other types of analysis is essential to understand the data fully.
Finding Insights From Your Heatmap Visualization Data
Here is how to analyze your heatmap data to uncover valuable insights.
1. Identify Low-Converting Areas: Low-converting areas are parts of your website that attract visitors but need to engage them more to make a purchase—perhaps adding a CTA or an image graphic to grab attention. Using heatmaps, you can identify these areas and brainstorm ways to make them more engaging.
2. Track Engagement & Measure Clicks: Engagement An effective marketing strategy includes engagement, which can benefit SEO. By tracking engagement with your website, you can identify where customers are dropping off and what keeps them from fully engaging with your content. Heatmaps can provide data on the number of clicks and the heat score of elements on your site. All this data can help you create more valuable content that keeps customers engaged in making a purchase.
3. Measure Success of Website Navigation Strategies: Heatmaps can help validate your website navigation strategies. You can identify which pages visitors visit most and how they land on them. Did they use a sidebar menu link, an anchor text on a blog page, or a breadcrumb link? Heatmaps can answer those questions and help improve your website navigation strategy.
4. Analyze Scrolling Behavior: Heatmaps can help you understand how far visitors scroll down the page. Scroll behavior can help you determine where to place content and CTAs for maximum engagement. If visitors scroll to the page's bottom, you can strategically place important content near the bottom.
5. Compare Device-based Performance: Heatmaps can also compare performance across different platforms, such as desktop, mobile, and tablet. With this insight, you can adjust your design to meet the needs of the device used to view your website. For example, if visitors have difficulty navigating your site on a mobile device, you can optimize the content to make it easier to access. Read more on how to make a mobile-friendly website design.
Heatmap visualizations can provide valuable insight into customer behavior and help you make informed decisions regarding improving your website and marketing campaigns.
Best Practices for Heatmap SEO
As you use heatmaps to uncover insights and make more informed decisions for your SEO efforts, it's important to remember a few heatmap best practices.
1. Use a Single Page: Using a single-page heatmap, you can avoid comparing data from multiple pages that may not be statistically significant. You can get more accurate and actionable insights.
2. Conduct A/B Testing: Using heatmaps to optimize your website content is a great idea, but you cannot decide based on one piece of data. You need to conduct A/B testing to discover which changes were most effective and which ones were not helpful.
3. Avoid Jumping to Conclusions: Heatmaps are potent tools, but you should not jump to conclusions based on the data. Instead, you should conduct a thorough analysis and make calculated decisions based on the data.
4. Keep Mobile Users in Mind: Ensure that your heatmaps are optimized for mobile devices, as many users access websites via smartphones and tablets.
Combine your heatmap SEO efforts with other user experience and optimization best practices to see faster results and improved conversions.
Closing Note on Heatmap for SEO
Understanding how visitors engage with your website and providing valuable content encourages users to stay on your website and convert into customers.
Google Analytics heatmaps are an excellent starting point for marketers, allowing them to uncover big-picture issues that cause friction and new chances to boost traffic and conversions. But to maximize your SEO efforts, use heatmapping tools and SEO platforms, such as Quattr.
With Quattr's AI-first website optimization software, you can outperform your competitors by increasing traffic and engagement. Quattr pinpoints precisely how your search traffic trends are shifting and what you should do to improve your rankings with a prioritized list of action items. Find out all the SEO platform features that Quattr offers.
Combine Heatmap Analytics with Prioritized SEO Recommendations!
Get StartedHeatmap SEO FAQs
What is a heatmap visualization?
Heatmap visualization, also known as heatmap data visualization, is a way of graphically expressing numerical data that uses colors to show the value of each data point. The warm-to-cool color scheme is the most widely utilized in heatmap visualization, with warm colors indicating high-value data points and cold colors representing low-value data points.
How can you use Google Analytics heatmap data?
Google Analytics heatmaps help analyze where visitors click, how far they scroll, and where they become disengaged. By identifying hotspots on a page, website owners can use heatmaps to understand user behavior better and optimize website design for higher conversions.
Does Google have its own Heatmap Tool?
Yes, Google has its heatmap tool that lets you observe how visitors interact with your website. Find which links they click on and which sections of your page they find interesting. If you want an engaged audience and a more significant discussion rate, you must understand your users' behavior and leverage it to your advantage.
About The Author

About Quattr
Quattr is an innovative and fast-growing venture-backed company based in Palo Alto, California USA. We are a Delaware corporation that has raised over $7M in venture capital. Quattr's AI-first platform evaluates like search engines to find opportunities across content, experience, and discoverability. A team of growth concierge analyze your data and recommends the top improvements to make for faster organic traffic growth. Growth-driven brands trust Quattr and are seeing sustained traffic growth.


