
Quattr MCP at work · Conversion metrics
Why did your conversion rate drop this quarter?
A conversion rate usually drops because of what it counts, not because buying broke: a blended number following its biggest goal, a shift toward browsing traffic, a tracking change, or plain week to week swing. Split it into goals before acting. In the video, purchases actually rose 18% while the blended rate fell.
The recording below is the whole workflow: 4 ordinary questions, asked in an AI chat with Quattr connected.
Conversion rate fell 7.5%. The number is real. The panic is not.
◐ Recreated from an anonymized sessionSplit your own rate before reporting it
This run
In this video, it splits a falling conversion rate into its goals and finds purchases rising underneath.
What the run returned
The numbers set the scope of the problem; the decision names the work that moves it.
Run the same analysis in a Quattr-connected AI chat
Four prompts, copied exactly as written; the video shows what comes back.
Requires the Quattr MCP connection to read your organization's data. The prompt alone will not return your numbers.
- Prompt 1 Our conversion rate is down this quarter. Is that real, or just noise?
- Prompt 2 Before we act on that, what is that number actually made of?
- Prompt 3 So which of the two actually moved?
- Prompt 4 So what should we actually be reporting?
How Quattr produced the answer
An ordinary question, answered from your own named sources.
Quattr MCP is the read-only bridge between your AI client and Quattr's connected search data and analytical tools. Agents and Skills turn those tools into repeatable search work.
How the Quattr MCP works → See these sources joined in one answer →
What actually makes a conversion rate drop?
Five causes; check what the number is made of before anyone acts on it.
01The blended number follows its biggest goal
Most conversion rates add every goal together, so the largest goal decides which way the number moves; browsing actions like cart adds usually dwarf purchases. You will see the rate fall while sales and revenue hold or rise. The fix: split the rate into one line per goal, and read the purchase line first.
02Fewer people browsed, not fewer bought
Window shopping swings with traffic and season far more than buying does, and browsing actions are most of what a blended rate counts. You will see cart adds falling while completed purchases stay level or climb. The fix: report browsing and buying as two numbers, so a quiet month of browsing never reads as a sales problem.
03The traffic mix shifted toward browsers
A viral page or broad, question-style searches bring visitors who look around but rarely buy, and any rate computed over everyone falls with them. You will see sessions growing faster than conversions, with the dip concentrated in the newest traffic sources. The fix: compare the rate for each traffic source separately, and judge each one against its own history.
04A goal or tag quietly changed
A retagged button, a new cookie banner or a redefined goal changes what gets counted, and the rate moves without any visitor changing behavior. You will see a sharp step on a single day rather than a slow slide across weeks. The fix: check the goal setup and the tag history for that date before touching the site.
05Normal variation read as a trend
Rates built on small purchase counts swing week to week on their own, and two badly chosen endpoints can manufacture a drop. You will see the fall shrink or vanish when every week of one period is compared against every week of the last. The fix: test the change against normal week to week swing before anyone acts on it.
Transcriptmachine-transcribed · corrected for product terms
0Conversion rate is down, and a room full of people already has a theory about why.
6So before any of that, let us find out whether there is anything to explain at all.
11So, the first question is the one worth asking before any theory, and it is the one everybody skips.
19So, it tests this Quattr against the one before it, comparing them week by week, right through the Quattr MCP.
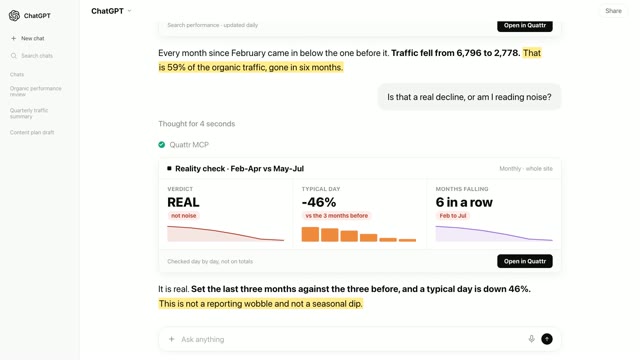
29And there we are. It is real. Not the usual wobble you get between any two months, but an actual change.
38Seven and a half percent down, and it holds up across 27 weeks of comparison.
46So, before anybody acts on that, it is worth asking what that number is actually made of.
54It breaks the conversion figure apart into the individual goals it is built from.
1:02Oh, that is telling. One goal is almost the entire number, and it is not the one you would want.
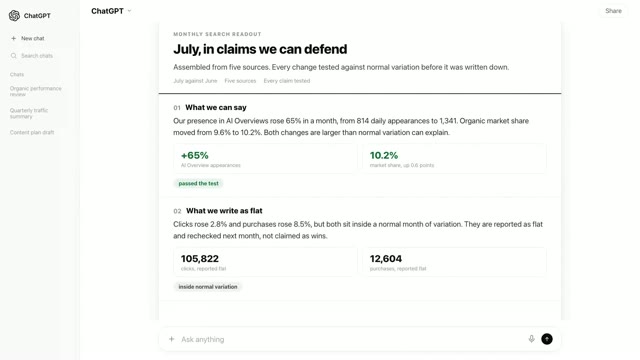
1:10Eighty-five percent of every conversion counted is somebody adding to a cart. Purchases are eleven.
1:19Which makes the next question obvious? Which of those two actually moved?
1:25It puts each goal against the same quarter a year of trading earlier.
1:37Carts down ten percent. Purchases up eighteen. The blended rate followed the browsing, because browsing is most of what it counts.
1:48So, the real question is what we should have been looking at instead.
1:52It pulls the purchases and the revenue that came with them.
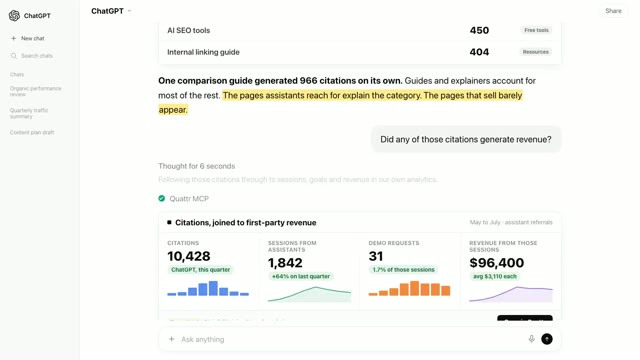
2:03Five thousand more purchases than last quarter, and roughly three hundred and seventy thousand more revenue.
2:11So, the quarter was better than the dashboard said, and the checkout they were about to rebuild is the part that improved.
2:18That is the Quattr MCP. It does not just tell you the number moved. It tells you whether the number was worth watching.
Frequently asked questions
Were the numbers in the video real?
This video is recreated from an anonymized session: the interaction is faithful to a real run on a connected account, and the figures shown have been changed or are illustrative rather than a customer’s own numbers.
Can the Quattr MCP run this breakdown on my site?
Yes. Connect Quattr to your AI chat once, then paste the four prompts above. The same sequence runs on your own numbers: real or noise, what the rate is made of, which goal moved, and what to report instead.
How does it know what the conversion number is made of?
The connected account tracks each goal by name, so the assistant reads the raw count behind every goal and shows each one's share of the blended rate. In the video that split was Add to Cart at 85% and Purchase at 11%, straight from the analytics setup.
Where do these prompts run?
In any AI chat that can use connectors (the standard is called MCP). The prompt never names Quattr; the connection is what routes the question to your data, which is why it reads like an ordinary question.
What data can the Quattr MCP read?
Search Console clicks, impressions and rankings, web analytics, paid search, search market share against competitors, AI visibility across assistants, and Core Web Vitals. Every answer is pulled live from the connected account, so the numbers match what your dashboards show.
Split your own rate before reporting it
Connect Quattr once and these prompts test your drop for noise, split the blended number into your own named goals, and show which one really moved.
Read-only · OAuth 2.1 · existing Quattr permissions · no API keys