
Quattr MCP at work · Speed and causation
Traffic rose after the fix: who gets the credit?
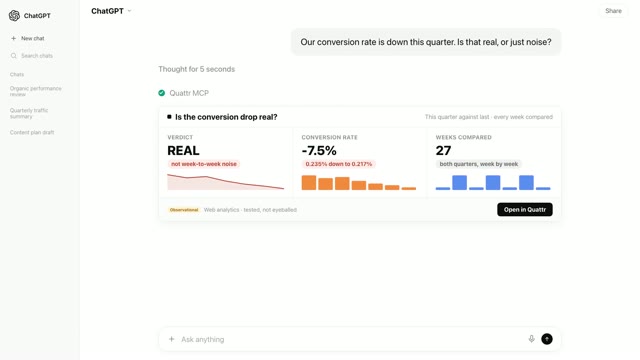
You settle it with checks, not with one chart. Test the rise against normal variation, ask whether faster pages actually earn more than slower ones, then list everything else that moved in the same window. In the video the 12% rise is real, and four separate changes could each explain it.
The recording below is the whole workflow: 4 ordinary questions, asked in an AI chat with Quattr connected.
The fix shipped. Traffic rose. Now two teams want the credit.
◐ Recreated from an anonymized sessionSettle the credit question on your own numbers
This run
In this video, it puts load time and clicks on one timeline, tests a 12% rise for significance, and lists the four changes that could each explain it.
What the run returned
The numbers set the scope of the problem; the decision names the work that moves it.
Run the same analysis in a Quattr-connected AI chat
Four prompts, copied exactly as written; the video shows what comes back.
Requires the Quattr MCP connection to read your organization's data. The prompt alone will not return your numbers.
- Prompt 1 Engineering shipped the site-speed fix in March, and traffic has been up since. Did the fix do it?
- Prompt 2 Check it properly then. Do our faster pages actually earn more than our slower ones?
- Prompt 3 So what else changed in the same window?
- Prompt 4 So what do we put in the deck, and how does engineering get real credit next time?
How Quattr produced the answer
An ordinary question, answered from your own named sources.
Quattr MCP is the read-only bridge between your AI client and Quattr's connected search data and analytical tools. Agents and Skills turn those tools into repeatable search work.
How the Quattr MCP works → See these sources joined in one answer →
When does a fix deserve credit for a traffic rise?
Five ways the one-chart story goes wrong; each with the sign that reveals it and the check that settles it.
01Together gets mistaken for because
Two lines moving on one timeline feel like proof, but the chart carries no direction and no cause. You will see the fix date, faster load times and rising clicks in one picture, with nothing that rules anything else out. The check: treat the chart as the question, then test the rise and list every other change before anyone claims it.
02Fast pages are not the earning pages
Speed can only explain a rise if the pages that earn the traffic are the ones that got quick, and on many sites the busiest templates are the heaviest. You will see the slowest quarter of the site earning more clicks than the fastest quarter, as it does in the video. The check: group every measured page by speed and read what each group actually earns before crediting the fix.
03Demand rose on its own
When searches for the category climb, clicks climb with them, fix or no fix. You will see demand up across the same window as the rise, 14% in this run. The check: read the category's demand as its own line, because a demand lift that size can carry the whole chart.
04Rankings moved for their own reasons
Average position on the money pages can improve from content work, links or an algorithm update in the same months a fix ships. You will see rankings up a position or two with no page-level tie to the speed work. The check: keep rank movement as its own dated line next to the fix, not folded into it.
05A rival slipped in the same window
Part of a rise can be another site falling, because a competitor's lost visibility gets redistributed across the results. You will see a rival down in the same months your clicks are up, 3 points in this run. The check: read the market picture beside your own numbers, so a rival's bad quarter is not booked as the fix's win.
Transcriptmachine-transcribed · corrected for product terms
0The fix shipped. Traffic rose. Now two teams want the credit.
13Engineering shipped the site-speed fix in March, and traffic has been up since. Did the fix do it?
21Putting load time and clicks on the same timeline, with the fix marked where it shipped.
36There is the picture everyone will put in the deck.
39The fix ships in March, pages get faster, and clicks climb 12% in the months after.
44They moved together, and that is exactly what needs checking, because together is not the same as because.
49Most rooms stop at this chart. We keep going.
53Check it properly then. Do our faster pages actually earn more than our slower ones?
1:04Splitting every page by its measured speed, and comparing what each group earns in clicks.
1:21And the first check finds a problem.
1:24On our own site, the slowest pages earn more clicks than the fastest ones, because the busiest pages are the heavy ones.
1:29If speed drove traffic here, fast pages should be winning. They are not, so the open-and-shut case just reopened.
1:34So what else changed in the same window?
1:41Listing everything else that moved between March and now, from every connected source.
1:58Four things moved in the same five months, and any of them lifts clicks.
2:01Faster pages, better rankings, more demand, and a rival slipping, all at once.
2:04There is no honest way to slice the credit between them, and anyone claiming an exact split is guessing.
2:07So what do we put in the deck, and how does engineering get real credit next time?
2:18Writing down what the data can defend, and what it honestly cannot.
2:32The rise is real and goes in the deck. The timing is true and stated as timing.
2:35The causal claim stays out, honestly.
2:38And the last line is the one that ends future arguments: the next fix ships with a holdout, a slice of pages left unchanged, so next time the credit is measured instead of debated.
2:49Together is not because.
2:56The rise confirmed real, the credit stated honestly, the next fix designed to prove itself. In the AI chat you already use.
Frequently asked questions
Were the numbers in the video real?
This video is recreated from an anonymized session: the interaction is faithful to a real run on a connected account, and the figures shown have been changed or are illustrative rather than a customer’s own numbers.
Can the Quattr MCP run this credit check on my site?
Yes. Connect Quattr to your AI chat once, then paste the four prompts above. The same sequence runs on your own numbers: the timeline with your change marked, faster pages against slower ones, every change that moved in the window, and a claim-by-claim verdict for the deck.
How does it decide whether the rise is real?
The rise is tested against the site's normal week-to-week variation, so a swing inside the usual range reads as noise instead of growth. Passing that test makes the rise real; it does not name the cause, which is why the co-movers are listed and the causal claim is left out of the deck.
Where do these prompts run?
In any AI chat that can use connectors (the standard is called MCP). The prompt never names Quattr; the connection is what routes the question to your data, which is why it reads like an ordinary question.
What data can the Quattr MCP read?
Search Console clicks, impressions and rankings, web analytics, paid search, search market share against competitors, AI visibility across assistants, and Core Web Vitals. Every answer is pulled live from the connected account, so the numbers match what your dashboards show.
Settle the credit question on your own numbers
Connect Quattr once and these prompts test your rise against normal variation, split your pages by measured speed, and list every change that moved in the window, so the deck claims only what the data can defend.
Read-only · OAuth 2.1 · existing Quattr permissions · no API keys