Quattr Leads AEO, SEO, and Content Rankings on G2 Spring 2026.
Quattr Leads AEO, SEO, and Content Rankings on G2 Spring 2026.

Did you know that the #1 ranking position on Google receives about 40% of clicks, while the second position captures only 18%? Understanding share of voice in SEO has become crucial for businesses seeking to measure their digital marketing effectiveness and set realistic growth targets. Yet many marketers struggle to determine what constitutes a good share of voice percentage for their specific situation.
Share of voice represents your brand's visibility across search engine results compared to competitors in your market space. It's a metric that reveals not just where you stand today, but also illuminates the path to improved search performance and market dominance. However, what qualifies as a "good" percentage varies dramatically based on your industry, business stage, market position, and strategic objectives.
Share of Voice (SOV) measures how visible your brand is compared to competitors in search results.
A “good” Share of Voice percentage depends on your industry, competition, and business goals.
Higher SOV often correlates with stronger brand awareness, traffic, and market authority.
Tracking SOV helps businesses understand competitive positioning beyond individual keyword rankings.
SEO Share of Voice should be monitored across branded, non-branded, and high-intent keywords.
AI search and Google AI Overviews are changing how Share of Voice is measured online.
Improving content quality, keyword coverage, internal linking, and authority can increase SOV over time.
Consistent Share of Voice growth is often a stronger indicator of SEO momentum than isolated rankings.
7.
8.
9.
10.
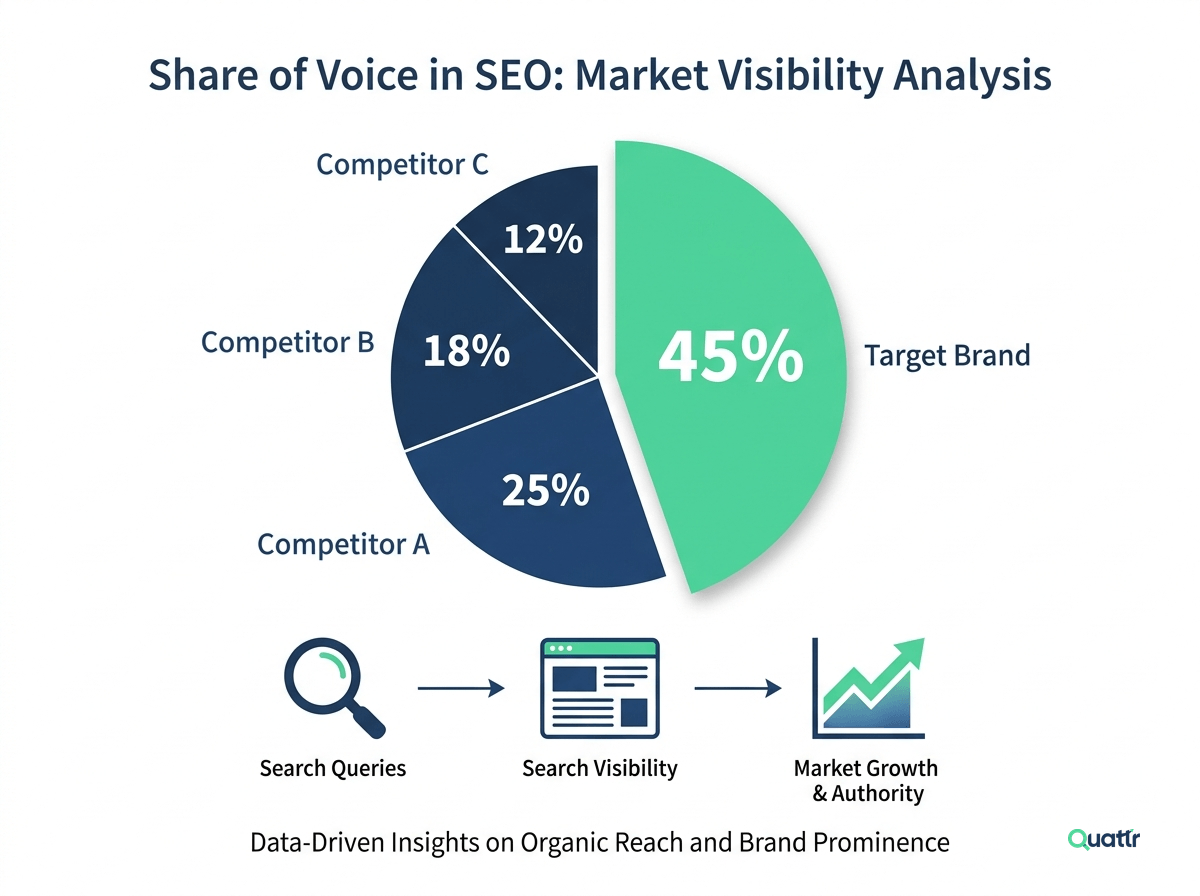
Share of voice in SEO measures the percentage of total search visibility your website captures for a specific set of keywords compared to your competitors. Unlike traditional advertising metrics, digital share of voice provides granular insights into your search performance across different market segments, geographic regions, and product categories.
The calculation involves tracking keyword rankings for you and your competitors, then determining what percentage of potential impressions, clicks, or visibility your brand receives. For example, if you rank #1 for a keyword that receives 10,000 monthly searches, and your click-through rate is 25%, you're capturing 2,500 clicks from that term. Your share of voice for that keyword would be calculated based on your visibility relative to competitors ranking for the same term.
SOV varies across contexts. A software company might have 40% for “project management tools” but only 5% for “business software.” A restaurant might dominate locally but have no national visibility. Segmenting by geography, product category, or brand vs. non-brand keywords makes SOV especially useful.
Modern SEO tools calculate SOV by weighting rankings based on search volume, CTR, and SERP features like snippets or local packs for a more accurate visibility picture.
Share of voice (SOV) measures visibility and brand presence across search results, while share of market (SOM) represents your actual revenue or unit sales as a percentage of total market activity.
SOV tracks impressions, clicks, and search visibility, essentially how often potential customers see your brand.
SOM, conversely, measures tangible business outcomes: the percentage of purchases, subscriptions, or revenue you capture relative to competitors.
High share of voice typically precedes share of market gains, making SOV a leading indicator of future business performance. When you dominate search visibility for key terms, you're positioning your brand to capture demand before competitors. Research consistently shows that brands with SOV exceeding their SOM tend to grow market share over time, while those with lower SOV than SOM often lose ground as competitors increase visibility.
Misalignment between these metrics reveals critical strategic insights.
High SOV but low SOM indicates poor conversion, strong visibility but weak user experience or pricing.
High SOM but low SOV suggests success through other channels but vulnerability in search visibility.
Share of voice (SOV) matters because it converts abstract ranking changes into a clear market-position signal: it shows where competitors are winning, where your content gaps sit, and which SEO efforts actually move the business needle. It also validates content and technical work: when visibility rises after an update, you’ve confirmed ROI and can reallocate resources to tactics that demonstrably improve market position rather than chasing vanity metrics like keyword counts or raw domain authority.
Tracking SOV continuously delivers operational benefits. Regular monitoring provides early warnings of algorithm shifts, competitor content launches, or link acquisition campaigns, letting teams react before traffic drops become business problems. It also helps distinguish meaningful visibility gains from empty traffic: teams that combine SOV with conversion data typically identify ranking opportunities 15–30% faster and improve traffic quality by focusing on keywords that drive real competitive advantage.
For practical use, monitor weekly for tactical responsiveness and monthly for strategic reporting, and track core KPIs such as overall SOV and month-over-month change, SOV by product/category or geography, competitive gaps versus top rivals, and the SOV-to-traffic efficiency ratio. These metrics translate visibility into business language that informs resource allocation and demonstrates SEO ROI.
Share of voice measurement varies significantly across marketing channels, with each requiring distinct methodologies, data sources, and interpretation frameworks. Understanding these differences prevents flawed comparisons and ensures accurate competitive benchmarking.
SEO share of voice derives from keyword rankings, search volumes, and estimated click-through rates based on SERP position and features. Tools like SEMrush or Ahrefs aggregate this data from search engine APIs and proprietary databases. PPC share of voice measures impression share, the percentage of available ad impressions your campaigns captured, directly from platform reporting (Google Ads, Microsoft Advertising).
Social share of voice tracks brand mentions, hashtags, and engagement metrics across platforms using social listening tools, measuring conversation volume rather than search visibility. PR share of voice quantifies media coverage through press mention counts, reach estimates, and sentiment scoring from media monitoring services.
Each channel presents unique caveats. SEO estimates rely on third-party ranking data that may not perfectly match actual search results. PPC impression share reflects budget constraints, not just competitive strength. Social metrics conflate brand advocacy with criticism unless sentiment is analyzed. PR reach calculations often overstate actual audience exposure. To align multi-channel share of voice, segment by campaign objective and audience rather than aggregating raw percentages.
Track each channel independently while identifying cross-channel amplification effects, such as PR coverage driving branded search volume, to inform integrated strategy without double-counting visibility. This segmented approach reveals which channels drive awareness versus conversion, optimizing resource allocation across your marketing mix.
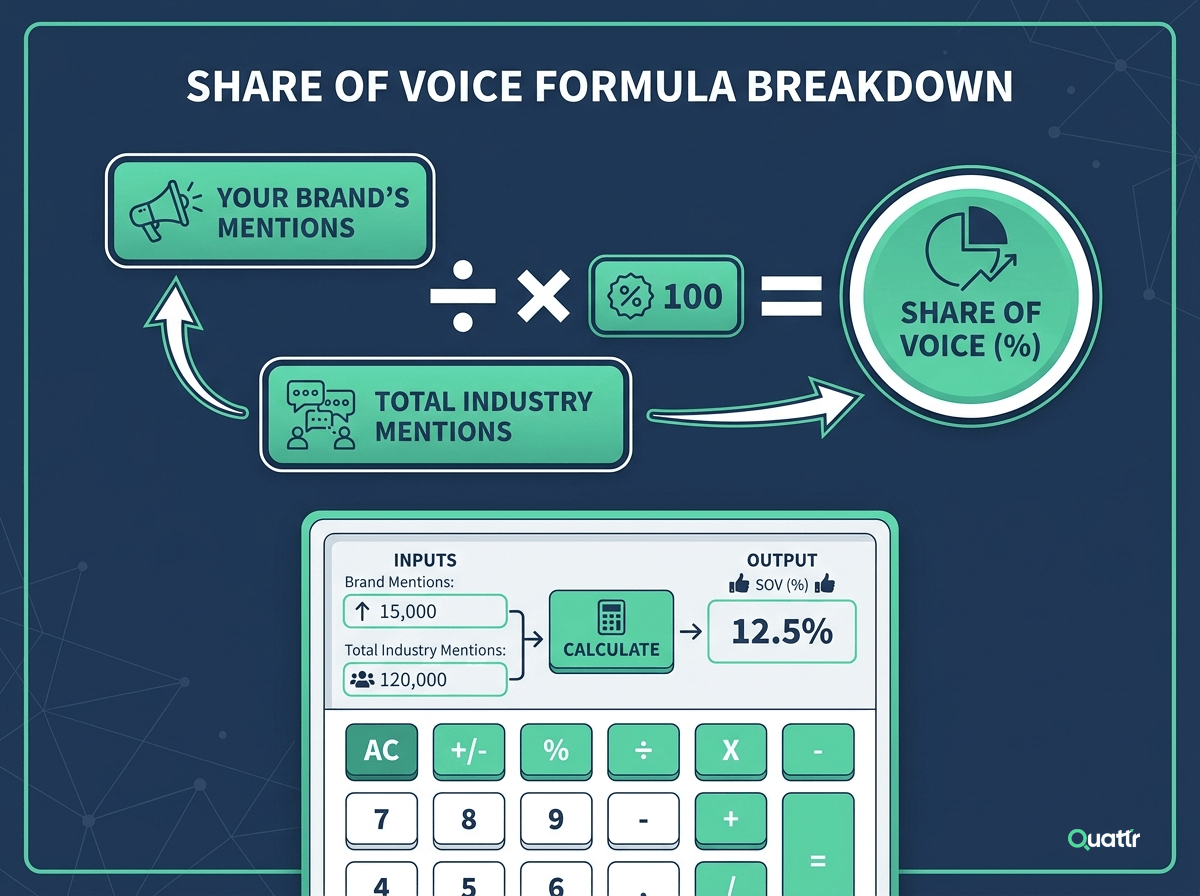
The fundamental share of voice formula is straightforward: SOV = (Your Estimated Traffic / Total Market Estimated Traffic) × 100. This calculation translates keyword rankings into visibility percentages by estimating potential traffic capture compared to competitors.
To build a basic SOV calculator, follow these steps:
1. Compile Your Keyword Set: Gather all target keywords with their monthly search volumes from tools like Google Keyword Planner or SEMrush.
2. Record Current Rankings: Document your ranking position for each keyword, along with competitor positions for the same terms.
3. Apply CTR Curves: Use position-based click-through rate models (position 1 ≈ 28-35% CTR, position 2 ≈ 15-20%, position 3 ≈ 10-12%, declining thereafter). Adjust for mobile vs. desktop devices.
4. Calculate Estimated Traffic: Multiply search volume × CTR percentage for each keyword to estimate potential clicks.
5. Aggregate Traffic Shares: Sum your estimated traffic and total market traffic (your traffic + all competitor traffic), then divide to determine your percentage.
For accuracy, weight SERP features separately, featured snippets capture 8-10% additional CTR, while local packs and image results shift organic click distribution. Segment calculations by brand versus non-brand keywords, as brand terms inflate overall SOV but don't reflect true competitive capture. Non-brand SOV provides clearer demand generation insights.
Understanding how your share of voice compares across positions, stages, and segments helps you gauge true competitive visibility. The following benchmarks break down SOV performance from different strategic angles.
Share of voice benchmarks vary significantly based on your current market position and competitive landscape.
Market leaders, those ranking consistently in positions 1-3 for their primary keywords, typically maintain share of voice percentages between 20-40% in moderately competitive industries. However, this figure fluctuates dramatically based on market concentration. In highly fragmented markets with numerous competitors, even the top player might only achieve 15-20% share of voice. Conversely, in dominated industries with 2-3 major players, the leader could capture 50-70% of total visibility.
The #1 player in most competitive markets should expect 25-35% share of voice as a baseline performance indicator. This percentage reflects not just top rankings for primary keywords, but also strong visibility across long-tail variations and related terms. Companies consistently hitting this benchmark typically enjoy significant advantages in brand recognition, traffic volume, and conversion opportunities.
Second and third-tier players face different reality. The #2 positioned brand usually captures 15-25% share of voice, while #3 positions often see 10-20% visibility. These percentages create important strategic implications, the gap between #1 and #2 is often smaller than many realize, suggesting that focused optimization efforts can quickly improve market position.
Determining what is a good share of voice percentage requires honest assessment of your business stage and realistic goal setting based on your current market position and resources.
Established businesses with strong market presence should target share of voice percentages that reflect their offline market position. If you're a recognized leader in your industry, achieving 20-30% share of voice represents reasonable performance, while 35%+ indicates exceptional digital marketing execution. These businesses have advantages in brand recognition, content authority, and link equity that should translate into strong search visibility.
However, established doesn't always mean digitally optimized. Many traditional businesses discover they're significantly underperforming their potential share of voice. A company with 40% offline market share but only 10% digital share of voice has clear optimization opportunities. These situations often yield the highest ROI from SEO investments, as existing brand equity accelerates ranking improvements.
New market entrants face different expectations and opportunities. Early-stage companies should initially target 2-5% share of voice in their primary market, focusing on specific niche keywords where competition is manageable. This targeted approach allows resource-constrained organizations to establish visibility in winnable battles rather than competing directly with established players on high-volume, highly competitive terms.
New entrants benefit from focusing on emerging search trends, long-tail keywords, and underserved market segments. A 3% share of voice concentrated in growing keyword categories often provides more valuable traffic than 1% spread across established terms dominated by competitors with superior domain authority and content resources.
Niche players operate under unique dynamics where small percentages can represent market dominance within specific segments. A specialized B2B software company might achieve only 5% share of voice in the broad "business software" category but maintain 40-60% visibility for their specific solution type. These businesses should focus on category-specific benchmarks rather than broad market measurements.
The key insight for niche players: depth often trumps breadth. Concentrating optimization efforts on precisely defined market segments where you can achieve 25%+ share of voice typically generates better results than diluted efforts across broader categories where you're unlikely to exceed 5-10% visibility.
Effective share of voice goal setting requires segmented analysis that reflects the complex nature of modern search behavior and business operations. Most companies operate across multiple market segments, geographic regions, and product categories, each requiring tailored approaches and benchmarks.
Primary market segments, your core business focus, should receive the most aggressive share of voice targets. Companies should aim for percentages that reflect their business objectives and competitive positioning. If you're investing heavily to become the market leader, targeting 25-35% share of voice in primary segments provides measurable progress indicators. More conservative growth strategies might target 15-25% as intermediate goals.
Secondary markets require different approaches. These segments might include adjacent product categories, geographic expansion areas, or complementary services. Realistic secondary market goals typically range from 5-15% share of voice, acknowledging limited resource allocation while maintaining growth optionality. Secondary markets often provide valuable testing grounds for optimization strategies before applying learnings to primary segments.
Geographic segmentation reveals crucial insights for goal setting. Local businesses might reasonably target 30-50% share of voice in their immediate market while accepting 2-5% in broader regional searches. National companies expanding internationally should expect significantly lower initial share of voice in new markets, often starting below 1% and building systematically.
Language considerations compound geographic challenges. Companies expanding into new language markets typically start with minimal share of voice, requiring 12-18 months of consistent optimization to achieve meaningful visibility. Setting incremental quarterly goals, perhaps targeting 1% in quarter one, 3% in quarter two, provides realistic progress milestones.
Product category analysis often reveals optimization opportunities. Many companies discover disproportionate share of voice across their product portfolio. A technology company might have 25% share of voice for their flagship product but only 5% for complementary solutions. These imbalances suggest resource reallocation opportunities or indicate natural market dynamics that inform strategic planning.
Share of voice data becomes most valuable when translated into actionable traffic and revenue projections that inform business planning and resource allocation decisions.
Converting share of voice to traffic estimates requires understanding the total addressable search volume for your market. If your industry generates 1 million monthly searches across tracked keywords, and you achieve 10% share of voice, you're potentially capturing visibility for 100,000 searches. However, visibility doesn't equal clicks, average click-through rates vary by position, SERP features, and industry.
Accurate traffic projections multiply share of voice by total search volume, then apply realistic click-through rate assumptions. Industry studies suggest organic search generates 15-25% overall click-through rates, but this varies significantly by ranking position and search intent. Informational queries often see higher click-through rates than transactional searches cluttered with ads and shopping results.
Revenue projections require additional conversion assumptions based on your website's historical performance. If your organic traffic converts at 3%, and you're projecting 50,000 monthly organic visits from improved share of voice, you might expect 1,500 additional conversions. Multiplying by average order value provides revenue estimates that justify optimization investments.
However, these projections should account for competitive responses and market dynamics. Improving your share of voice often triggers competitor reactions, potentially limiting actual gains. Additionally, seasonal fluctuations, market trends, and algorithm updates can impact the reliability of linear projections.
Conservative modeling applies 70-80% confidence intervals to share of voice projections, acknowledging the various factors that might prevent achieving theoretical maximums. This approach provides more reliable business planning inputs while maintaining growth ambitions.
The accuracy of share of voice measurements depends on several critical factors that influence both data quality and strategic decision-making reliability.
Keyword portfolio comprehensiveness significantly impacts measurement accuracy. Tracking 100 keywords provides general directional insights, but tracking 1,000+ keywords relevant to your business generates more reliable share of voice calculations. Many companies underestimate the breadth of search terms driving traffic to their websites, leading to incomplete competitive analysis.
Keyword predictability affects measurement stability. Established, high-volume keywords with consistent search patterns provide more reliable share of voice metrics than trending or seasonal terms. Building your core measurement set around stable keywords while supplementing with trending terms creates balanced accuracy.
Measurement frequency influences data reliability and strategic responsiveness. Daily tracking provides granular insights but may show excessive volatility. Weekly measurements typically offer optimal balance between responsiveness and stability, while monthly tracking suits longer-term strategic planning but may miss important competitive movements.
Geographic and device segmentation accuracy depends on your SEO tool's data coverage and methodology. Some tools excel at desktop tracking but provide limited mobile insights. Others offer strong US data but weaker international coverage. Understanding your measurement tool's strengths and limitations helps interpret share of voice data appropriately.
SERP feature inclusion affects measurement accuracy significantly. Traditional share of voice calculations focused solely on organic rankings, but modern search results include featured snippets, local packs, image results, and other elements that impact visibility. Tools that incorporate these features provide more accurate share of voice representations.
Manual share of voice tracking through spreadsheets suffices for businesses monitoring fewer than 50 keywords with 2-3 competitors in a single market. Understanding share of voice in SEO at this scale requires only basic rank checking and manual calculations. Once your tracking needs exceed this threshold or you require share of voice benchmarks across multiple market segments, a dedicated tool becomes essential for accuracy and efficiency.
Evaluate share of voice tools against these criteria:
1. Keyword Coverage: 500-1,000 keywords minimum for mid-market brands, 5,000+ for enterprises
2. SERP Feature Modeling: tracks featured snippets, local packs, knowledge panels impacting visibility
3. Device/Geo Tracking: separate desktop and mobile rankings across all target markets
4. Competitor Monitoring: tracks 5-15 competitors with automated daily or weekly updates
5. API and Export Options: enables integration with analytics platforms and custom reporting
6. Alerting Capabilities: notifications for significant ranking shifts or competitor movements
Small teams (1-3 people) with budgets under $200/month can start with basic rank tracking tools. Mid-sized teams (4-10) benefit from dedicated SEO platforms ($300-$1,000/month) offering comprehensive competitive analysis. Enterprise organizations typically require enterprise-grade solutions ($1,500+/month) with API access, custom segmentation, and advanced forecasting capabilities aligned with what is a good share of voice percentage for their market position.
Understanding what is a good share of voice percentage requires contextual analysis that considers your market position, business stage, competitive landscape, and strategic objectives. While industry leaders might target 25–35% share of voice, emerging businesses should focus on achieving 3–5% in carefully selected market segments.
The most effective share of voice strategies segment analysis across geographic markets, product categories, and business priorities. Rather than pursuing broad market dominance, companies often achieve better results by concentrating efforts on winnable battles where they can achieve meaningful visibility percentages.
However, traditional SOV tracking, based purely on keyword rankings, now provides only part of the visibility picture. With AI-driven answer and generative engine search experiences like Google AI Overviews, ChatGPT, and Perplexity reshaping discovery, Quattr’s Share of Voice metric goes beyond rankings to measure true multi-surface visibility.
Quattr’s SOV metric unifies visibility data across traditional SERPs, AI Overviews, and answer engines, integrating first-party click and impression data from Google Search Console. This gives marketers a single, accurate view of how much real visibility their brand owns across search, AI answers, and emerging surfaces.
By combining traditional SOV tracking with Quattr’s AI Visibility analytics, you can pinpoint where competitors outrank you in both organic and AI-generated search results, identify lost opportunities, and measure how optimization efforts translate into actual market share growth.
Start by auditing your current share of voice across key market segments using Quattr’s AI Visibility Dashboard, then set incremental improvement targets aligned with your business goals. With consistent optimization and unified SOV tracking, you’ll not only understand where your brand stands, but also how to own a larger share of every search and answer experience.
Retail and e-commerce sectors typically see 10-20% SOV as competitive, while B2B software leaders may achieve 25-35%. Professional services often consider 15-25% strong performance. Industry competitiveness matters more than absolute percentages, focus on gaining 5-10 percentage points above your closest competitor.
Track weekly for responsive optimization and monthly for strategic planning. Daily tracking suits enterprises monitoring multiple competitors, while quarterly reviews work for small businesses with limited resources. Always measure after major content launches or algorithm updates to validate impact.
SEO share of voice measures organic rankings and SERP features, while PPC SOV tracks impression share and ad positions. Social SOV focuses on mentions and engagement, whereas PR SOV counts media coverage. Each channel uses different data sources, avoid comparing percentages directly across channels without context.
.jpg)
Quattr is an AI-native Search Visibility Platform founded in Palo Alto, California, built for mid-market and enterprise brands competing in the age of generative search. Recently recognized across G2’s Spring 2026 reports with #1 rankings in AEO Results, Usability, and Relationship, Quattr helps brands win visibility across traditional search and AI-generated answer surfaces.
Quattr’s AI agent, GIGA, evaluates content the way AI systems do, identifying gaps across structure, authority, internal linking, and discoverability to surface the highest-impact fixes. With capabilities like autonomous internal linking, E-E-A-T intelligence, and the new GIGA Landing Page Generator for keyword-matched, AI-search-ready pages, Quattr helps teams move from diagnosis to deployed changes without manual bottlenecks.


Try our growth engine for free with a test drive.
Our AI SEO platform will analyze your website and provide you with insights on the top opportunities for your site across content, experience, and discoverability metrics that are actionable and personalized to your brand.
.svg)
.svg)


