Quattr Leads AEO, SEO, and Content Rankings on G2 Spring 2026.
Quattr Leads AEO, SEO, and Content Rankings on G2 Spring 2026.

To deliver the best experience, optimizing your website for performance is essential. Many developers and site owners aim for a perfect 100/100 on Google PageSpeed Insights, which helps identify what’s slowing your site down and offers actionable recommendations. In this guide, you’ll learn how to use PageSpeed Insights, check your score, and improve it to build faster, better-performing websites that enhance user experience.
7.
8.
9.
10.
PageSpeed Insights (PSI) is a free tool by Google that evaluates how a web page performs on both mobile and desktop devices. It analyzes the page using real user data (field data) as well as simulated tests (lab data). Based on this, it offers clear, actionable recommendations to improve loading speed, enhance user experience, and boost SEO performance.
PageSpeed Insights (PSI) assigns a number from 0 to 100, with 100 representing the quickest loading time.
However, improving your PSI score to 100 does not necessarily equate to a number #1 ranking on SERP. According to Google, PSI is not a ranking factor. It is just a tool to help you identify the issue you must work on.
Page Speed is a metric developed by Google to measure how quickly web pages load. It measures how long a web page can download and become viewable to a website visitor.
Users care about page performance because the longer a page takes to load, the lower the satisfaction rate with that page.
According to a study by Kissmetrics, if a web page takes longer than 3 seconds to load, over a quarter of users will click away and choose a different search result.
Page Speed is determined using a combination of factors, such as server response time, the number of requests a page makes, code complexity, and the page size. Web admins often use it to optimize the performance of their sites and enhance user experience.
Google's ranking system prioritizes websites with fast-loading pages over those with slower-loading pages. If your website loads slowly, you avoid getting displayed on search results compared to your competitor's site, which loads faster.
Therefore, the PageSpeed score matters for the website's visibility on search results, the user's satisfaction with the page's performance, and the website's overall success.
Page Speed Insights is an excellent tool for analyzing a website's performance and identifying potential improvements. But, like any other tool, it has its advantages and disadvantages. Below we highlight a few.
1. Provides quick insights into how a website is performing
2. Shows you summarized information on multiple lab & field data metrics via an easy-to-understand rating system
3. Offers easy-to-understand suggestions for improving page load times
4. Identifies potential issues with a website's desktop and mobile versions
5. Offers detailed reports about page performance obtained straight from Google, which confirms its accuracy and dependability
1. It may not be as thorough as other tools
2. Results may vary depending on the browser version
3. Results may differ between desktop and mobile versions of a website
4. It only provides information one page at a time which can be difficult for domains with thousands of pages
Page Speed Insights scores measure a website's performance on a scale of 0-100. The higher the score, the better the website's performance. The scores evaluate Google's performance metrics, which measure how fast a page loads and how well it responds to user input.
A website with a PSI score of 90 or higher performs well. A website with a PSI score of 0-30 could be a better score. Everything in the middle is considered average and called 'Needing Improvement.’

PSI states that all metrics have a 75th percentile. 75% of all page loads will load faster than the reported metrics. For example, a website with a PSI score of 90 means that 75% of page loads and user interactions were faster than the page's performance for the given page.
Page Speed Insights scores are based on real user experience. By determining the 75th percentile, Google can focus on users likely to experience the slowest page load times, ensuring that website owners also focus on improving their sites for these users.
Using the 75th percentile also ensures that the scores look at long-term performance since a website can have an artificially high score due to a single fast page load. Using the 75th percentile approach, Google avoids these spikes when computing the scores.
Page Speed Insights scores are calculated based on two primary data sources: field and lab data.
Field data sources measure the performance of real-world page loads from Chrome users on an Android device. It is collected from the Chrome User Experience Report and displays the last 28-day report to measure real-world website visitors.
Field data lets developers see how their website performs on different devices and networks.
PSI tracks real-world users' First Contentful Paint (FCP), First Input Delay (FID), Largest Contentful Paint (LCP), and Cumulative Layout Shift (CLS) during 28 days. PSI additionally reports on experimental measures such as Interaction to Next Paint (INP) and Time to First Byte (TTFB).

Lab data sources measure the performance of simulated page loads in a lab-controlled environment. The data is collected from the Chrome Lighthouse Audits tool. It measures the technical aspects of the page, such as the size of the page, the amount of time it takes to render, and the requests made when a page is loaded.
Both data sources measure a website's performance and generate PSI scores.
The page's performance on several metrics is also displayed in the Performance category, as mentioned:
1. First Contentful Paint: The First Contentful Paint (FCP) metric tracks the time it takes from when the page first loads to when any part of the page's content appears on the screen.
2. Largest Contentful Paint: The LCP metric measures the duration for the most significant image or text block visible in the viewport to render compared to when the page starts to load.
3. Speed Index: The Speed Index assesses how quickly content appears visually during page load. Lighthouse begins by recording a video of the page loading in the browser and then computes the visual evolution between frames.
4. Cumulative Layout Shift: CLS measures the most powerful burst of layout shift scores for each unexpected layout change throughout a page.
5. Time to Interactive: The TTI metric counts the time it takes from the beginning of the page to the loading of its primary sub-resources. It is capable of consistently reacting to user interaction swiftly.
6. Total Blocking Time: Total Blocking Time (TBT) is the total time between First Contentful Paint (FCP) and Time to Interactive (TTI), during which the main thread was stalled long enough to impede input response.
Although Google PageSpeed Insights provides a thoroughly evaluated report on the web page's performance, it could be more dependable and accurate. Page speed insights score is not reliable and accurate because of several factors.
1. Page Speed Insights does not represent page speed in real-world settings. It does not evaluate site performance through the eyes of the user, i.e., user experience.
For Example, say you have applied lazy loading on your website. In this scenario, the first thing that would be loaded must be well-optimized. In this case, the overall page load time is meaningless because the slower loading assets below the fold, i.e., out of the user's view, have little effect on the user experience. But PSI doesn’t consider this, and their report shows your website is slow.
2. Page Speed Insights needs to comprehend your unique website, specialty, industry, or goals. Instead, they rely on generic code that returns a simple yes/no response. It frequently indicates issues irrelevant to your configuration and exaggerates elements that have little to no impact on your actual website performance or, more crucially, user experience.
3. The score calculated by Page Speed Insights needs to be more consistent, meaning you can see different scores without changing your website. It has been confirmed by Google’s Senior Search Analyst, John Mueller, stating that these ratings are not physical and may alter over time, regardless of whether the website has changed.
Google PSI calculates the performance of your website for mobile and desktop devices. The only difference between those two reports is their computed score.
Mobile Page Speed scores differ from desktop Page Speed scores because of how mobile devices process information. Processors in mobile devices are typically slower than desktop processors, meaning that the Page Speed Insights tool works slower when running a test on a mobile device. Read our Mobile Page Speed Guide to know more.
Another reason is that the CSS rules for mobile devices are often device-specific, meaning that resizing images and elements for different screen sizes may slow down the page speed even further. Finally, a mobile network may cause slower page speeds due to data transfer from the server to the device.
Most websites load slowly because huge graphics occupy too much space. However, slow loading is only sometimes the case for some websites. Before making the required modifications to score higher on the Page Speed Insights tool, you must first understand what is causing your website’s poor performance.
Follow the steps to check Page Speed Insights for your website:
Step 1: Open Google’s PageSpeed Insights tool to get started.
Step 2: Enter the URL of your website and click Analyze.
After a few seconds of analysis, you will receive a report with the overall performance score and a breakdown of other areas. During the processing, the tool performs two steps:
First, it collects 'field data' from the web page in the CrUX, which is the Chrome User Experience report.
The page performance is then measured using the Lighthouse API. It calculates the loading rate in a controlled and simulated environment, which includes mid-tier devices and mobile networks.
Improving page speed is critical for enhancing user experience, reducing bounce rates, and improving SEO rankings. Some page speed best practices to optimize website performance and achieve faster loading times include:
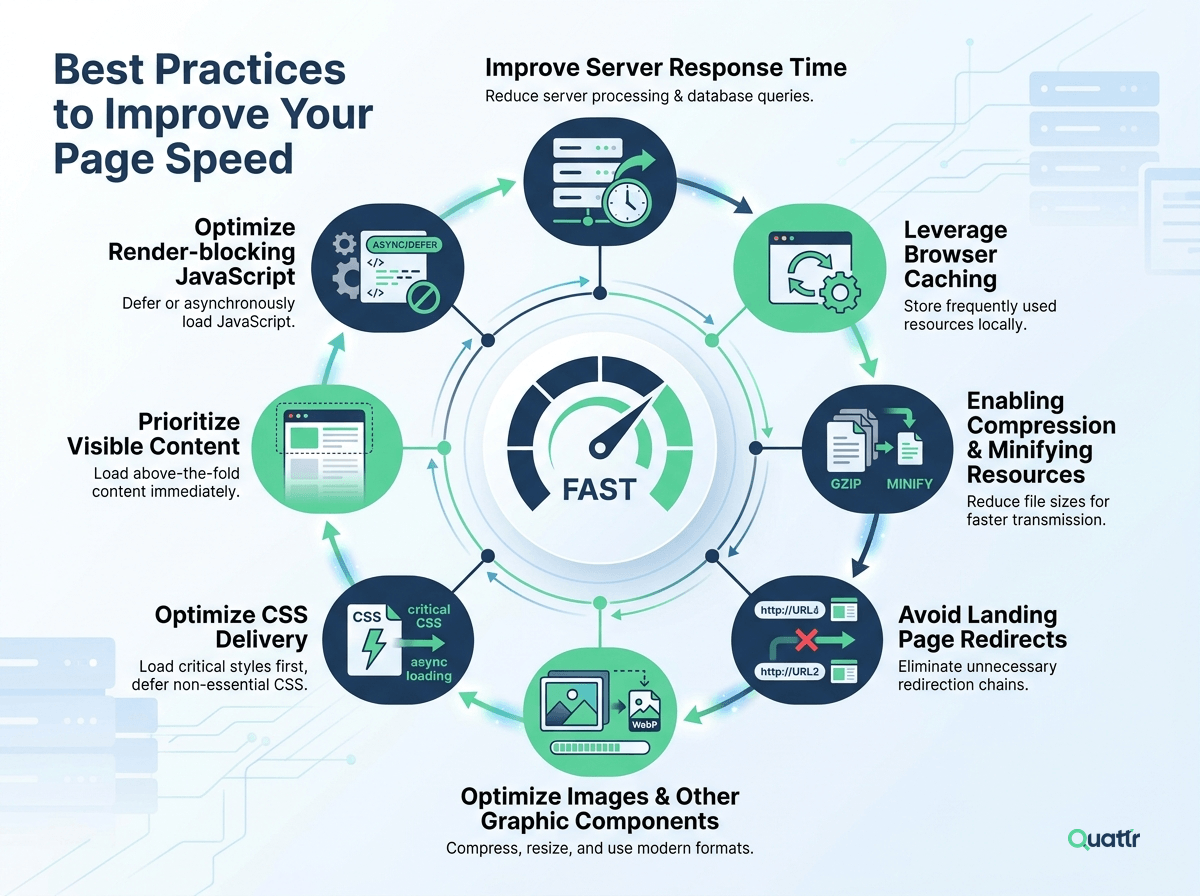
Server response time or Time to First Byte (TTFB) refers to the time it takes for a web server to respond to a user's request. Slow server response times can significantly affect page speed, delaying the start of the page rendering process.
Optimizing server configurations, using a content delivery network (CDN), and reducing database queries can help improve the server response times and increase dwell time.
Check out the documentation page for more information on Improving Server Response Time.
Browser caching allows web pages to be stored locally in a user's browser, reducing the need to fetch resources from the server for subsequent page visits. It can significantly improve page load times for returning visitors, as the locally stored resources can be retrieved quickly without needing to be downloaded again from the server.
Setting appropriate caching headers and leveraging browser caching can optimize website performance, reduce server load, and enhance user experience. Understand browser caching in-depth by visiting the documentation page.
Compressing and Minifying resources such as HTML, CSS, and JavaScript involves removing unnecessary characters, spaces, and comments to reduce file size. Enabling compression, such as Gzip compression, on your web server can significantly reduce the file size of these resources, resulting in faster downloads. It can improve page speed as browsers transmit and quickly process smaller files.
Read more about enabling compression & minifying resources by visiting the documentation page.
Landing page redirects occur when a URL redirects to another URL before displaying the content to the user. These redirects can add unnecessary delays in loading time, negatively impacting both user experience & SEO. Each redirect adds a round-trip request, increasing the time it takes for the page to load.
It is best to minimize the use of redirects and instead directly link to the intended landing page to reduce unnecessary round-trip requests and improve page speed. It can result in lower bounce rates, increased user engagement, and improved search engine rankings.
Learn more about the Avoiding Landing Page Redirects through Google’s documentation page.
Images are often one of the most significant assets on a web page and can significantly impact page speed. Optimizing images by compressing them, resizing them to appropriate dimensions & using modern image formats can help reduce their file size without sacrificing quality. Optimizing images makes your website load faster, improving user experience and positively impacting your Click-through rate.
Learn more about SEO and optimizing images.
Optimizing CSS (Cascading Style Sheets) delivery involves efficiently loading and rendering CSS files to improve page speed. CSS files control the visual appearance of web pages, and optimizing their delivery can significantly impact the overall performance of a website.
Best practices for optimizing CSS delivery include minimizing the number of CSS files, reducing CSS file sizes through minification and compression, and leveraging techniques such as inline CSS, critical CSS, or asynchronous loading to prioritize rendering visible content.
Visit the documentation page to learn more about Optimizing CSS Delivery.
Prioritizing visible content involves structuring web pages to allow the most critical content to be loaded and displayed to users quickly. It can improve page speed and overall user experience by ensuring users can access the relevant content without delays. Best practices for prioritizing visible content include:
1. Optimizing the HTML structure to load the most important content first.
2. Avoiding excessive use of JavaScript or other elements that can block rendering.
3. Leveraging lazy loading techniques for non-critical content.
Click here to read more about Prioritizing Visible Content.
Render-blocking JavaScript refers to the JavaScript files that prevent the rendering of a web page until they are fully loaded and executed. It can significantly slow down page load times and negatively impact user experience.
It would be best if you focused on optimizing JavaScript delivery by deferring or asynchronously loading non-critical JavaScript files & minimizing the use of blocking JavaScript that is not necessary for the initial page rendering. Doing so lets the page load and render quickly, providing a smooth user experience and improving search engine rankings.
You can learn more about Render Blocking JavaScript by visiting Google’s documentation page.
Google PageSpeed Insights has become increasingly important with the rise of Core Web Vitals, helping identify technical issues that impact page speed and overall performance. However, relying only on PSI isn’t enough due to variations in scores and limited context.
That’s where Quattr adds value by continuously analyzing your website, identifying performance gaps, and prioritizing fixes based on potential traffic impact. It also tracks metrics like rankings, impressions, and page speed over time while comparing them with competitors, helping you focus on the improvements that truly enhance user experience and SEO performance.
Page Speed Insights measures a website's loading times and other performance metrics, including time to first byte, first contentful paint, and largest contentful paint. It also recommends improving a website's performance, including optimizing images, minifying code, and improving server response times.
Page Speed Insights are not 100% accurate. The performance report will vary based on factors such as test location, internet speed, CPU performance, chrome & lighthouse version, etc.
The primary difference between Google Lighthouse and Page Speed Insight is data sourcing. Lighthouse uses only lab data in a controlled environment to provide the performance report of your website. In contrast, Page Speed Insights uses lab and field data (real-world data) to generate performance reports.
Google uses the 75th percentile when calculating the PageSpeed Insights score because it provides a more representative and reliable measure of the page loading speed for most users. The 75th percentile represents the value below which 75% of the data points fall, indicating that it eliminates the outliers or extreme values that may skew the results.

Quattr is an AI-native Search Visibility Platform founded in Palo Alto, California, built for mid-market and enterprise brands competing in the age of generative search. Recently recognized across G2’s Spring 2026 reports with #1 rankings in AEO Results, Usability, and Relationship, Quattr helps brands win visibility across traditional search and AI-generated answer surfaces.
Quattr’s AI agent, GIGA, evaluates content the way AI systems do, identifying gaps across structure, authority, internal linking, and discoverability to surface the highest-impact fixes. With capabilities like autonomous internal linking, E-E-A-T intelligence, and the new GIGA Landing Page Generator for keyword-matched, AI-search-ready pages, Quattr helps teams move from diagnosis to deployed changes without manual bottlenecks.


Try our growth engine for free with a test drive.
Our AI SEO platform will analyze your website and provide you with insights on the top opportunities for your site across content, experience, and discoverability metrics that are actionable and personalized to your brand.

.svg)
.svg)


