
Performance score
also called Lighthouse performance score
Definition
The Lighthouse performance score for your pages, averaged across the pages in scope.
How it's calculated
Read from the product's weighted summary measure, which averages the per-page weighted performance score. Unlike the three Core Web Vitals, the headline prefers the product's own latest-daily snapshot, the most recent day on which its four score families were all populated, and falls back to the period summary when no such day exists. Display rounds to three decimal places; grading buckets at 0.9 and 0.5, with the comparison reversed because higher is better here.
Scope, grain and dimensions
- Grain
- One number per date range, optionally split by device, or one row per page.
- Dimensions
- page · device
- Required filters
- date_range
- Aggregation
- The headline is the weighted summary measure read without a page dimension, or the latest fully populated daily value where one exists. Averaging page-level values again would give every page equal weight.
- Metric type
- score · score between 0 and 1
Data sources
Where you'll see this
Named reports that normally include this metric.
Skills and analyses that use it
Skills carry the judgment; the analysis verbs do the reading.
Analysis verbs
site_health_cwv_check
Method rungs and levers
This sits on the bottom rung: if it reads badly, every measurement above it is unreliable.
levers L1 Technical & crawl health
Ask Quattr
- "What is our performance score?" Simulate this →
- "Which pages score worst on performance?" Simulate this →
How to read it
The one figure in this set on a true zero-to-one Lighthouse scale, and, on its own, the input to the overall page-experience verdict, which is worth knowing before quoting that verdict. It is NOT what the worst-pages list is ranked by; that ranking is by slowest rendering time.
Caveats, freshness and failure modes
Stored zero to one, not zero to a hundred. A score of 0.62 is presented as 62, multiplied by a hundred and rounded to a whole score point, without a percent sign.
It sits on a different scale from the timing vitals, which are in seconds, so the four page-experience numbers can never be compared to each other as numbers.
Its headline can be anchored to a different day from the other three vitals: it prefers the latest day on which the product's four score families were all populated, while they stay on period aggregates.
The overall page-experience verdict is derived from this vital alone.
These are lab measurements, not field data from real visitors; collection cadence varies by site and by page.
- Freshness
- varies by site, priority URLs can run nightly; most pages far less often. The collection date rides on the card rather than being assumed.
Common failure modes
- Comparing a zero-to-one score against a seconds-based vital as if they shared a scale.
- Rendering it as a decimal percentage rather than a whole score point.
- Assuming the worst-pages list is ranked by this score, it is ranked by rendering time.
- Quoting the overall verdict without knowing it comes from this vital only.
Not the same as
The confusions that cause the most wrong decisions.
Performance score Overall page-experience verdict Compare definitions →
One is a numeric average, the other is the graded bucket presented as a site-wide verdict. Score and verdict are kept separate, and in this case the verdict is derived from this score alone.
Performance score Lighthouse category scores Compare definitions →
The performance score is graded and drives the overall verdict; those eight are ungraded and drive nothing. The performance score also shares the 0-to-1 scale of four of them, which is exactly why the two are confused.
Watch this metric read in a real run
All runs →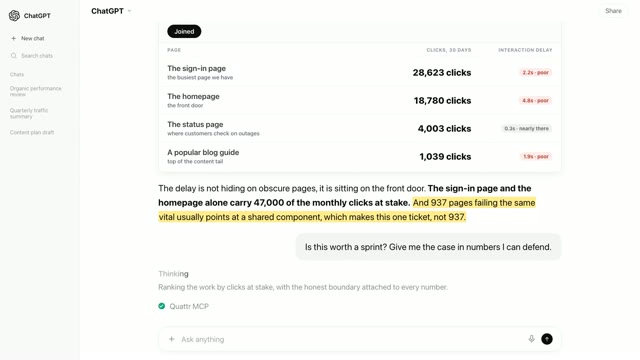
Related metrics and workflows
Verification
A definition is the smallest part of this.
The measurement matters because something acts on it. Here is the rest of the showcase, in the order most people find useful.