
Quattr's own daily observation
Lighthouse and Core Web Vitals as an MCP data source
Request a demo Play this question →
- Varies by page, date on card
- OAuth 2.1 · read-only
- Claude, ChatGPT, Cursor, VS Code
- LCP · INP · CLS · scores
- Lab measurement, not field data
Asked in your assistant
Which slow pages are actually costing us something?
This source, on its own
- LCP, mobile3.4s
- Pages graded poor27%
- Performance score61
this source stops here
- ✕Is this what users felt?lab, not field
- ✕Was that run a fluke?one run, one number
- ✕Do rivals load faster?your pages only
- ✕What line of code is slow?scores, not traces
The same question, routed wider
- ✓ Lighthouse / CWV LCP, INP, CLS per page
- ✓ Search Console the clicks each page earns
- ✓ GA4 or Adobe the conversions at stake
- ✓ Your taxonomy grouped into templates
What comes back
- Slow templates3
- Clicks they carry41%
- Fix list6 pages
Illustrative
- Setup~2 minutesNothing to connect. Quattr runs the audits; you ask about them.
- ScopeRead-onlyThe MCP reads completed runs. It cannot start an audit.
- Sources behind itEightVitals alone work. Seven more join when connected.
- Tools58 across 11 categoriesFour cover page experience; the assistant routes to them.
What a Lighthouse MCP server does
An MCP server is the connection between your assistant and a system that holds data. Quattr runs Lighthouse against your pages on a schedule and keeps the results: largest contentful paint, interaction to next paint, cumulative layout shift, and the category scores for performance, accessibility, best practices and SEO, page by page and by device.
Measuring a page is the easy half, and free tools do it well. The half that decides whether anyone acts is knowing which slow pages carry the traffic. A slow page nobody visits and a slow page carrying a tenth of your entrances are different problems that look identical in a list of scores.
Connect Lighthouse in about two minutes
Nothing to authorise for this source. The audits run on your account already.
- 01 Add the endpoint Paste it into your client's MCP settings. One server, every source, there is no per-source endpoint to manage.
https://mcp.quattr.com/mcp - 02 Sign in with Quattr OAuth 2.1 in the browser. The session is bound to your organisation and scoped read-only; no API key is created or stored in your client.
- 03 Ask about a device Mobile and desktop are measured separately and answered separately, because averaging them produces a number that describes nobody's experience.
What you can ask on day one
Plain questions, not audit configuration. Each one runs against completed audits alone, though the first is better with Search Console connected.
-
Which of our highest-traffic pages have the worst LCP on mobile? -
Did any vital get worse this month, and on which templates? -
How does LCP differ across rank buckets? -
Show me the grade distribution for INP across the site. -
Which pages fail more than one Core Web Vital at once?
The Lighthouse tools it exposes
-
site_health_cwv_checkPer-vital grades and distributions for a period, with the weakest pages named. R1 Reachable -
page_traffic_cwvTop pages by organic clicks with one vital attached to each, for triage by cost. R1 Reachable -
cwv_breakdownOne vital grouped by rank bucket, device or content category, with clicks beside it. R1 Reachable -
correlate_domainsWhether a vital moves with clicks or sessions here, reported with the caveat attached. R5 Rewarded
You never name one of these. The assistant routes the question; the reference is public so an answer can be checked against what it was built from.
Where Lighthouse / CWV reads, what it assumes beneath, and what it cannot reach. Filled rungs are measured; hatched rungs are taken on faith.
- R5 Rewarded reads here One tool, the correlation join: lab performance read against traffic outcomes.
- R4 Represented assumed, not measured This source takes this rung on faith. Another one has to prove it.
- R3 Referenced assumed, not measured This source takes this rung on faith. Another one has to prove it.
- R2 Retrieved assumed, not measured This source takes this rung on faith. Another one has to prove it.
- R1 Reachable reads here Three tools: whether the page can be served and rendered at all, under lab conditions.
A reading at any rung is only as trustworthy as the rungs beneath it. The distance is this page's argument. Three tools sit at the bottom; the fourth reaches the top by crossing three rungs it does not measure. That is a correlation, and the page says so.
Where a single-source vitals MCP stops
Not at a feature the vendor forgot. At the edge of what a page audit records.
- What is the slowness costing? A vital is a measurement, not a loss. Sizing the problem needs the impressions and clicks the slow templates carry, which are recorded on Google's side rather than in an audit. needs Search Console
- Did fixing it change anything? A later run shows the vital improved. Whether sessions and conversions followed sits on the other side of the click, and the honest answer is a correlation with a caveat until a holdout proves otherwise. needs GA4 / Adobe
- Were crawlers served slowly too? An audit measures a browser loading a page. What a crawler was actually served, and how long it waited, is a separate measurement recorded at your own origin. needs Server logs
- Which template is this page? Vitals arrive per URL. Grouping thousands of URLs into the handful of templates an engineering team can actually fix needs the structure a crawl maps. needs Site crawl
Seven more sources answer what Lighthouse structurally cannot
Every source is one you already own or one Quattr collects for you. Connect none of them and the vitals answers still work. Connect Search Console and a list of slow pages becomes a fix list ordered by what the slowness costs.
- Search Console yours The weighting that turns scores into priorities. Which slow templates carry impressions and clicks, and which are slow where nobody is looking. 1 to 2 days behind
- GA4 or Adobe yours What a slow step costs in conversions against your named goals, which is the version of this argument a finance conversation accepts. loads nightly
- Site crawl Quattr The structure that turns per-URL vitals into per-template findings, so a fix is shipped once rather than argued about page by page. per crawl schedule
- Server logs yours What crawlers were served and how long they waited, which is a different measurement from what a browser experienced on the same URL. hours to nightly
- Google Ads yours Page experience on the destinations you pay to send people to, where slowness raises cost per conversion without ever appearing in the ads account. ~1 day behind
- AI visibility Quattr Page experience on the templates answer engines cite most, for when referral traffic lands somewhere that loses people before it renders. ~1 day behind
- Rank tracking Quattr Whether a page-experience regression and a change in standing landed on the same segment, which is a prompt to investigate rather than a conclusion. ~1 day behind
- The ladder that orders them R1 Reachable → R2 Retrieved → R3 Referenced → R4 Represented → R5 Rewarded. A broken lower rung invalidates every reading above it. The method →
Quattr MCP compared with a standalone performance MCP
A category comparison, not a claim about any one vendor. A standalone connector is a good piece of software doing a narrower job; the table is here so you can tell which situation you are in before installing anything.
| Dimension | A standalone connector | Quattr MCP | When it matters |
|---|---|---|---|
| How the measurement is taken | Drives a live browser on demand, records a real trace, and can pull real-user field data alongside it. | Scheduled lab runs per page, with the collection date carried on every card. | If you need a live audit right now, or real-user field data, that tool is the one. |
| Debugging depth | Traces, console messages, network requests and screenshots. It can point at the code responsible. | Vitals and category scores per page. It can tell you where the problem is, not which line causes it. | When the question is what to change in the codebase. |
| Coverage | The URL you point it at, one page at a time, whenever you ask. | Every page in the audited set, graded and comparable, without anyone choosing which to check. | When the question is which pages rather than this page. |
| The traffic join | No access to your search or analytics data, so a slow page and an important page look identical. | Vitals weighted by the clicks and conversions each page actually carries. | When the fix list has to be ordered by what the slowness costs. |
| Other sources | None. One server per source; your assistant holds several unrelated connectors. | Seven more behind the same endpoint, joined on the URL and on your templates. | The moment page experience has to be argued about in business terms. |
| Trend integrity | Each run is a fresh number, and a trend is whatever you stitch together from repeated runs. | Period buckets are computed natively, and a trend is never assembled by stacking snapshots. | When month-over-month page experience goes into a report someone acts on. |
| Time to first answer | Minutes. Install it, point it at a URL, read the trace. | Minutes once the account is set up, because the audited page set and templates exist before the first question. | Honestly, this row favours the standalone tool when you want an answer in the next ten minutes. |
| Cost | Free and open source, from the browser vendor itself. | Included with a Quattr subscription. No separate MCP product, no separate bill. | If you are not a Quattr customer, the standalone tool is the one you can use this afternoon. |
Rows describe a category, checked against publicly documented behaviour. Named-vendor claims live on the comparison pages, dated. If a row is wrong or out of date, it is a defect, tell us and it changes.
What Lighthouse itself will not tell you
- These are lab runs, not field dataAudits are reproducible and comparable to each other, which is what makes them useful for tracking change. They are not what your visitors experienced, which is measured by real-user reporting instead.
- Cadence varies by pagePriority URLs can run nightly and most pages far less often, so a vital measured three weeks ago is reported as three weeks old rather than as current. The collection date rides on the card.
- A single run is a noisy numberLighthouse results vary between runs on the same page for reasons that have nothing to do with your site. Grades and trends across repeated runs carry more weight than any individual score.
- Speed is not proven to cause rankWhether a vital moves with clicks on your site can be computed and is worth knowing. Whether improving it caused anything needs a holdout, which is a test to design rather than a number to read.
Freshness, permissions and what is stored
- Freshness
- Varies by page. Priority URLs can run nightly and most run far less often, so every card names the date the measurement was collected.
- Scope
- Read-only. The MCP reads completed audits and cannot start, schedule or reconfigure one.
- Sign-in
- OAuth 2.1 in the browser. No API key is minted or stored in your client config.
- Tenancy
- Sessions are bound to your organisation. A session cannot reach another tenant's audits.
- Your prompts
- Your assistant sends the question to the server to route it. It is not used to train anything.
- Scores and units
- LCP and INP are reported in seconds and CLS is unitless. Lighthouse category scores are whole points out of a hundred rather than percentages, because reading them as percentages invites a wrong comparison.
Origin event to answered card for Lighthouse / CWV, with the stage each stated limit attaches to.
- lag enters
- data leaves
- modelling begins
- 01 Scheduled lab run per page and device
- data leaves: Lab, not field. No real visitor is in this number.
- lag enters: Cadence varies by page, so two pages are not necessarily comparable in time.
- 02 Metrics captured
- data leaves: A single run is a noisy number.
- 03 Stored per run
- 04 Correlated against traffic
- modelling begins: Speed is not proven to cause rank. This join is correlation and is labelled as such.
- 05 Reported
Who can connect it, and what it costs
This is a source Quattr collects rather than one you connect. There is no property to authorise: if your organisation uses Quattr, audits are already running against the page set configured for your account, and the MCP is a way to ask about the results where you are already working.
Measurement itself is not scarce here, and it would be dishonest to pretend otherwise. The browser vendor gives away a tool that audits any page live and in more depth than this does. What this adds is the weighting, which slow pages carry the traffic, so if the question is one page rather than which pages, take the free tool.
Learn to read the numbers yourself
- topic The Reachable sweep Ranking technical issues by the traffic at risk instead of by error count.
- metric Largest contentful paint What it measures, what a lab figure is worth, and the thresholds that grade it.
- metric Performance score How the score is composed, why it moves between runs, and how to present it.
- report The Core Web Vitals report What belongs in it, and why a site average is the least useful number in it.
Questions people ask before connecting
Is this Core Web Vitals from real users?
No. These are lab audits run on a schedule, which is what makes them comparable over time. Real-user field data is a separate measurement and answers a different question about the same page.
Can it audit a page on demand?
No. It reads audits that have already run. For a live check of one URL right now, the browser vendor's own free tool does that and does it better.
How often is a given page measured?
It varies by site and by page. Priority URLs can run nightly while most run far less often, which is why the collection date appears on every answer rather than being assumed.
Why is our performance score 61 rather than 61%?
Lighthouse category scores are points out of a hundred, not percentages. Presenting them with a percent sign invites people to compare them with rates that are genuinely percentages, and the comparison is meaningless.
Can it tell me what to fix in the code?
No. It reports vitals and scores per page. Traces, console output and network waterfalls come from a browser-side tool, and that is the right instrument for the next step.
Will improving vitals improve our rankings?
It can compute whether the two move together on your site, and it will not claim more than that. Establishing cause needs a holdout test, which is something to design rather than a figure to look up.
What if I connect nothing else?
Grades, distributions, regressions and per-device splits all work. The traffic weighting that turns them into a ranked fix list is what wants Search Console connected.
Is a standalone performance MCP ever the better choice?
Yes, often. For auditing one page live, debugging a specific problem, or getting real-user field data, the free browser-vendor tool is more capable than this and costs nothing.
All eight sources, one spine
Watch this source answer real questions
All runs →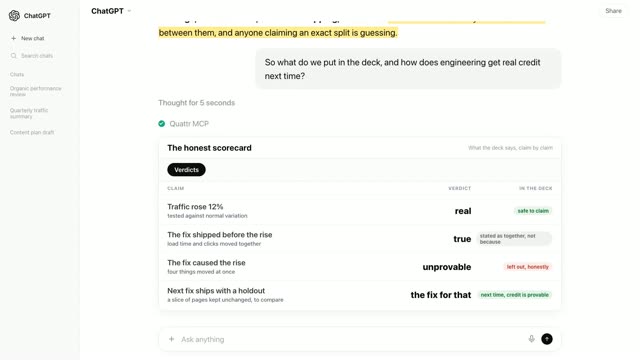 3 min 4 secThe fix shipped. Traffic rose. Now two teams want the credit.Lighthouse + Search Console + Rank tracking · Significance referee · Cross domain correlator◐Recreated from an anonymized session
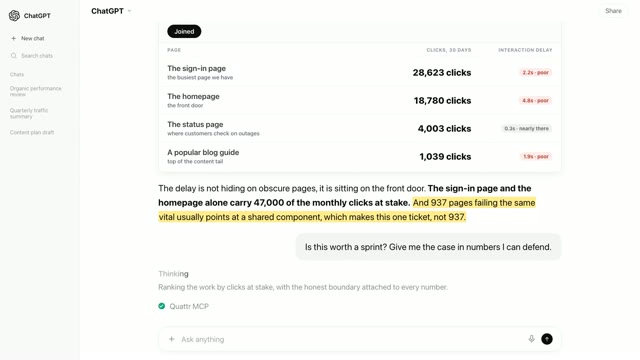 2 min 27 secThe screenshot says the site is slow. The sprint costs real money.Lighthouse + Search Console · CWV regression watch◐Recreated from an anonymized session