
AI Overview average daily results-page count
also called Average daily count of SERPs with an AI OverviewAIO results-page denominator
Definition
The average daily number of a segment's observed results pages that carried an AI Overview, the denominator of the AI Overview inclusion rate, and the same number for every domain.
How it's calculated
Read as a player-independent measure on the same dataset, it belongs to the results-page population, not to any domain, so it is selected once and returned with an empty competitor list. The semantic layer counts the distinct observed results pages and divides by the number of distinct observed days, so it is a per-day average rather than a period population size. Live-verified at 98,007 on the tenant used for the inclusion reconciliation, where 33,721.5 over 98,007 reproduces the displayed 34.41%.
Scope, grain and dimensions
- Grain
- One segment × period × medium.
- Dimensions
- intent · brand · country · device
- Required filters
- segment_id · selected_period · serp_feature_filter
- Aggregation
- A per-day average: the count of distinct observed days is the divisor. Comparing two periods compares two daily averages, which is still the right way to watch the surface itself move, but multiplying it by the number of days does not give a period count.
- Metric type
- raw measure · average daily count of observed results pages carrying an AI Overview
Data sources
Where you'll see this
Named reports that normally include this metric.
AI Overview and SERP feature report
Skills and analyses that use it
Skills carry the judgment; the analysis verbs do the reading.
Analysis verbs
competitive_overviewcompetitive_trends
Method rungs and levers
A rung tells you what a movement here can and cannot explain, read the rungs below it first.
levers L2 Demand modeling
Ask Quattr
- "Is Google showing AI Overviews on more of our tracked demand than before?" Simulate this →
- "Did the AI Overview population change between these two periods?" Simulate this →
How to read it
A read on the surface itself rather than on your performance. A rising daily average with flat visibility means the answer box spread across more of your demand while your presence stood still, a market change, not a site change, and the most common reason an inclusion rate falls without anything going wrong.
Caveats, freshness and failure modes
It is a per-day average, not a period population. The measure divides by the count of distinct observed days, so it answers "how many AI Overview pages on a typical day", never "how many over the period".
It is player-independent: it is identical for you and for every tracked rival, so it never belongs in a competitive comparison column.
It counts observed results pages in the tracked segment, not all results pages on the web.
It is scoped by the AI Overview results-page feature filter the verbs inject.
- Freshness
- ~1 day behind, Daily observation, available the following day.
Common failure modes
- Reporting it as "the number of results pages that carried an AI Overview this period", it is a daily average, and the period figure is larger.
- Presenting it per competitor, which implies a difference that cannot exist.
- Ignoring it when narrating an inclusion-rate move.
Not the same as
The confusions that cause the most wrong decisions.
AI Overview average daily results-page count AI Overview inclusion Compare definitions →
This is the denominator, a per-day average count of pages carrying the feature, while inclusion is your presence rate within that population.
Watch this metric read in a real run
All runs →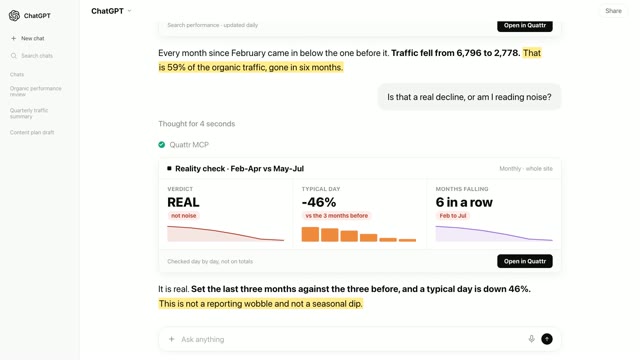 2 min 5 secTraffic more than halved in six months. Nobody could say why.Search Console · Anomaly investigator◐Recreated from an anonymized session
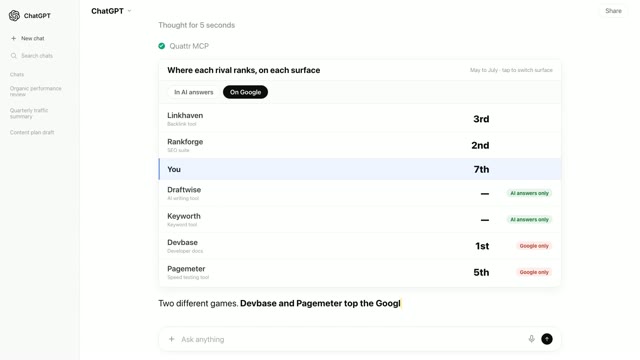 2 min 27 secYou know who beats you on Google. AI search has a different list.AI visibility + Rank tracking · AI vs traditional gap◐Recreated from an anonymized session
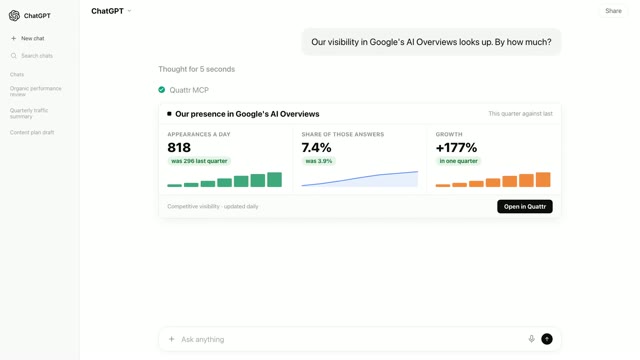 2 min 2 secSomething went right this quarter. Now prove it before you say it out loud.Rank tracking + Search Console · SERP feature watch · Significance referee◐Recreated from an anonymized session
Related metrics and workflows
Verification
A definition is the smallest part of this.
The measurement matters because something acts on it. Here is the rest of the showcase, in the order most people find useful.