
Vital grade distribution
also called Grade spreadPages by band
Definition
How many of your pages fall into each grade band for a given vital.
How it's calculated
Every page row's raw value for the vital is graded individually and tallied into the three bands. Rows with a non-numeric value are excluded from the tally rather than counted as poor.
Scope, grain and dimensions
- Grain
- Three counts per vital per date range, optionally per device.
- Dimensions
- page · device
- Required filters
- date_range
- Aggregation
- Counts of pages, not of measurements. The three counts add to the number of pages with a numeric value for that vital, which can be fewer than the total page count.
- Metric type
- derived metric · page counts per band
Data sources
Where you'll see this
Named reports that normally include this metric.
Skills and analyses that use it
Skills carry the judgment; the analysis verbs do the reading.
Analysis verbs
site_health_cwv_check
Method rungs and levers
This sits on the bottom rung: if it reads badly, every measurement above it is unreliable.
levers L1 Technical & crawl health
Ask Quattr
- "How many pages fail LCP?" Simulate this →
- "Is the problem site-wide or a handful of pages?" Simulate this →
How to read it
The shape behind the headline. A good weighted average with a heavy poor bucket is a template problem on a minority of pages; a middling average with everything bunched in the middle band is a site-wide one. The two call for different work, and only the distribution tells them apart.
Caveats, freshness and failure modes
The page rows are capped, so the distribution describes the pages that were read, not every page on the site. A response that lands exactly on the cap says so, and must not then be described as covering the whole site.
The distribution is built from per-page values while the headline grade is built from the product's summary measure, the two can disagree, and that disagreement is informative rather than a defect.
With results split by device the rows are page-by-device observations rather than pages, so the band counts count measurements, not pages.
Pages without a numeric value for a vital are excluded from its tally, so the three bands can sum to different totals across vitals.
Collection cadence varies by page, so a distribution mixes measurements taken at different times.
- Freshness
- varies by site, priority URLs can run nightly; most pages far less often. The collection date rides on the card rather than being assumed.
Common failure modes
- Reading the band counts as a share of all site pages.
- Expecting the distribution's modal band to match the headline grade.
Not the same as
The confusions that cause the most wrong decisions.
Vital grade distribution Vital grade Compare definitions →
One grade describes one value; the distribution describes how the pages spread across bands. A site graded good can still have a large poor bucket.
Watch this metric read in a real run
All runs →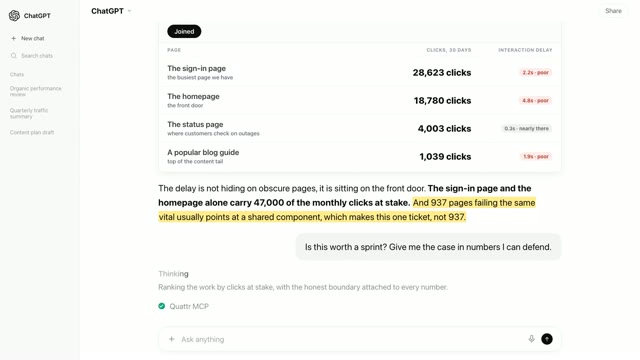
Related metrics and workflows
Metrics
Verification
A definition is the smallest part of this.
The measurement matters because something acts on it. Here is the rest of the showcase, in the order most people find useful.