
Pearson correlation
also called Pearson rLinear correlation
Definition
How closely two metrics move together in a straight-line sense, over aligned time buckets.
How it's calculated
Each metric is fetched as a bucketed series through a governed read, the two series are aligned on the shared time bucket in the compute engine, and the product-moment coefficient is computed on the aligned pairs. A t-statistic is formed from the coefficient with two fewer degrees of freedom than pairs, but its probability is NOT read from a t-distribution: the statistic is rescaled by a Cornish to Fisher term and fed to the standard normal curve. A perfect coefficient short-circuits to a probability of zero.
- Numerator
- The covariance of the two aligned series
- Denominator
- The product of their standard deviations
Scope, grain and dimensions
- Grain
- One value per metric pair, date range and bucket size.
- Dimensions
- bucket
- Required filters
- date_range
- Aggregation
- One coefficient per pair of series. Coefficients are never averaged or chained.
- Metric type
- statistical verdict · coefficient between −1 and 1
Data sources
Skills and analyses that use it
Skills carry the judgment; the analysis verbs do the reading.
Analysis verbs
correlate_domains
Method rungs and levers
A rung tells you what a movement here can and cannot explain, read the rungs below it first.
Ask Quattr
- "Does page speed move with our clicks?" Simulate this →
- "Does search market share track traffic?" Simulate this →
How to read it
A relationship, described in bounded language: correlates, moves with, consistent with. Never drives, causes or explains. Where the answer would drive spend or work, the correct next step is a designed test rather than a stronger adjective.
Caveats, freshness and failure modes
The significance attached to the coefficient is approximate: a normal approximation with a Cornish to Fisher correction, which is anti-conservative at small degrees of freedom, at five, the probability can be understated by roughly a quarter. A cross-domain correlation often runs on a handful of aligned buckets, so treat a borderline significance on a short series as unproven.
Correlation is not causation, and the payload carries that caveat with the sample size attached.
Shared trends and confounds inflate it, two metrics that both rise seasonally will correlate without being related.
It measures straight-line association only and is sensitive to outliers; the rank-based coefficient is the robust alternative and both are returned by default.
At least three buckets are needed on each side and at least three aligned buckets after the join, or the tool returns an explanatory note instead of a coefficient.
The two series are aligned by bucket, so the freshness of the slowest contributing source governs the whole read, page experience is the least predictable and is named when it is one of the pair.
An insignificant coefficient is reported as no detectable relationship at this power, not as no relationship.
- Freshness
- varies by site, priority URLs can run nightly; most pages far less often. The collection date rides on the card rather than being assumed.
Common failure modes
- Describing the significance as a t-test result, no t-distribution is evaluated.
- Reading a strong coefficient as a causal mechanism.
- Correlating two metrics that share an obvious driver and reporting the result as a finding.
- Computing a coefficient by hand when the tool declined to and presenting it as a product number.
Not the same as
The confusions that cause the most wrong decisions.
Pearson correlation Spearman correlation Compare definitions →
Pearson measures straight-line association on the values; Spearman measures monotonic association on their ranks. They disagree exactly where the relationship is real but not linear, or where an outlier dominates.
Pearson correlation Practical magnitude Compare definitions →
A coefficient describes the tightness of a relationship, not its business size, and no interval is computed around it.
Watch this metric read in a real run
All runs →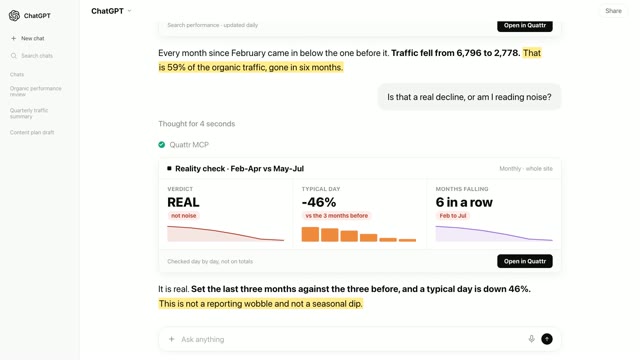 2 min 5 secTraffic more than halved in six months. Nobody could say why.Search Console · Anomaly investigator◐Recreated from an anonymized session
 3 min 4 secThe fix shipped. Traffic rose. Now two teams want the credit.Lighthouse + Search Console + Rank tracking · Significance referee · Cross domain correlator◐Recreated from an anonymized session
Related metrics and workflows
Metrics
Verification
A definition is the smallest part of this.
The measurement matters because something acts on it. Here is the rest of the showcase, in the order most people find useful.