
p-value
also called Significance valuep
Definition
The probability of seeing a difference at least this large if there were no real difference between the two periods or samples.
How it's calculated
One of two tests, chosen by sample size, and both run on per-bucket series rather than on period totals. Welch's two-sample t-test with Welch to Satterthwaite degrees of freedom is the default; where either period has fewer than eight buckets the cross-domain tool switches to the Mann to Whitney U rank test, using a normal approximation with a continuity correction. Conversion rate is no exception, it is tested with Welch's t-test over its per-bucket rate values, like every other metric. Both tests are computed in a pure module, never by the model.
Scope, grain and dimensions
- Grain
- One value per test, a metric, a pair of date ranges, and a bucket size.
- Required filters
- date_range · comparison_range
- Aggregation
- One p-value per test. It is never averaged, combined across tests, or carried between metrics.
- Metric type
- statistical verdict · probability between 0 and 1, rounded to six decimal places
Data sources
Where you'll see this
Named reports that normally include this metric.
Skills and analyses that use it
Skills carry the judgment; the analysis verbs do the reading.
Skills
significance-refereeanomaly-investigatorrank-movement-reviewmonthly-exec-reviewcross-domain-correlator
Analysis verbs
pop_significancesignificance_checkcorrelate_domains
Method rungs and levers
A rung tells you what a movement here can and cannot explain, read the rungs below it first.
Ask Quattr
- "Is this drop real?" Simulate this →
- "Is the lift statistically significant?" Simulate this →
- "Can we trust this change?" Simulate this →
How to read it
Evidence that a difference exists, and nothing more. It is not the probability the change is real, not a measure of how big the change is, and not a cause. Read it with the sample size beside it, the same p-value means something different at eight buckets and at eighty.
Caveats, freshness and failure modes
No exact t-distribution is ever evaluated. The t-statistic is real, but its probability comes from a normal approximation with a Cornish to Fisher correction, documented in code as anti-conservative at small degrees of freedom: at five degrees of freedom the probability can be understated by roughly a quarter. Treat samples under ten as indicative rather than definitive.
The Mann to Whitney probability also uses a normal approximation; the exact distribution would be preferable below about twenty observations.
A pooled two-proportion test exists in the statistics module but nothing calls it. There is no count-based proportion test anywhere in the tool surface, a rate is tested as a series of bucket values, not as successes over trials, and the cross-domain tool records the proportion case as deferred.
Every test compares per-bucket MEANS, not aggregate totals, a change in total driven by more buckets rather than bigger buckets will not show here, and where a displayed period aggregate moves opposite to the bucket means the rate-aware tool withholds the result rather than transferring it.
The cross-domain tool needs at least two buckets per period and returns an explanatory note instead of a test below that.
No multiple-comparison correction is applied anywhere. Testing many metrics or many rows will produce significant results by chance, and nothing in the tool surface adjusts for it.
A significant change is still not a cause. The tools rule on existence, never on attribution.
- Freshness
- varies by site, priority URLs can run nightly; most pages far less often. The collection date rides on the card rather than being assumed.
Common failure modes
- Reading the p-value as the probability that the change is real.
- Running many tests and reporting the significant ones without noting that nothing corrected for the number of tests.
- Treating a small p-value as evidence of a large or important change.
Not the same as
The confusions that cause the most wrong decisions.
p-value Practical magnitude Compare definitions →
The p-value speaks to whether a difference is distinguishable from noise; magnitude speaks to whether it matters. No effect size, minimum detectable effect or confidence interval is computed by any tool, so magnitude cannot be read off this number.
p-value Relative change Compare definitions →
Evidence versus size. Neither implies the other, and reporting one in place of the other is the most common misreading of a significance result.
Watch this metric read in a real run
All runs →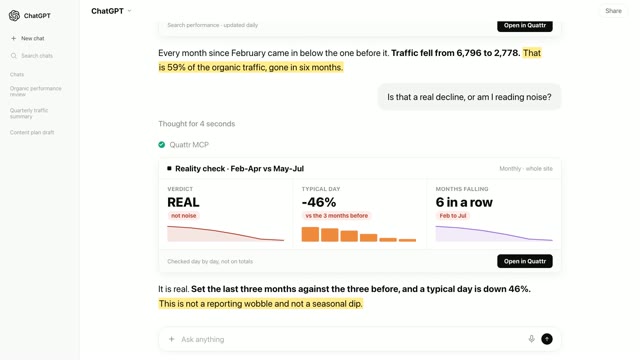 2 min 5 secTraffic more than halved in six months. Nobody could say why.Search Console · Anomaly investigator◐Recreated from an anonymized session
 3 min 4 secThe fix shipped. Traffic rose. Now two teams want the credit.Lighthouse + Search Console + Rank tracking · Significance referee · Cross domain correlator◐Recreated from an anonymized session
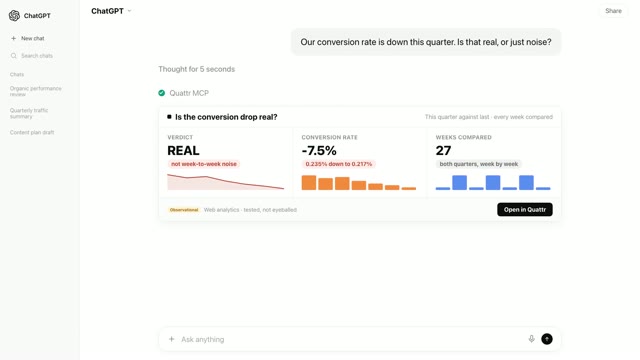 2 min 26 secConversion rate fell 7.5%. The number is real. The panic is not.Web analytics · Significance referee◐Recreated from an anonymized session
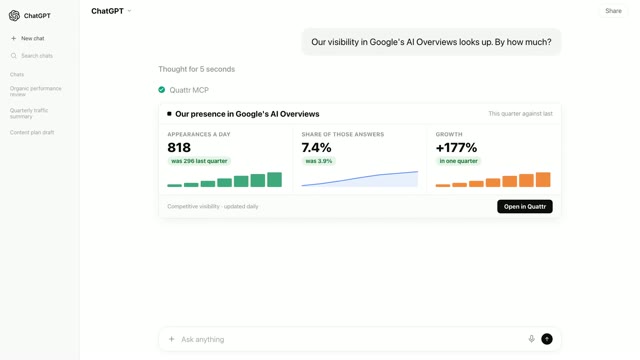 2 min 2 secSomething went right this quarter. Now prove it before you say it out loud.Rank tracking + Search Console · SERP feature watch · Significance referee◐Recreated from an anonymized session
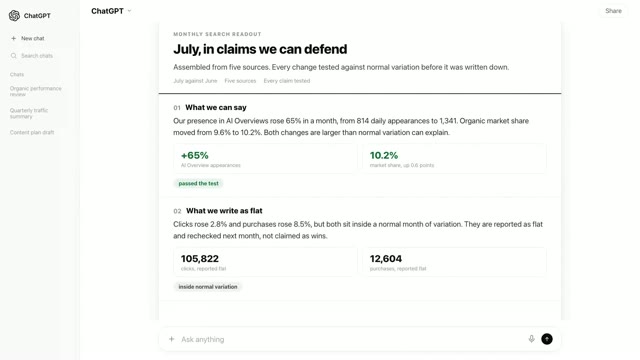 2 min 18 secThe deck is due tomorrow. The numbers live in five places.Search Console + Rank tracking + AI visibility + Web analytics + Google Ads · Monthly exec review◐Recreated from an anonymized session
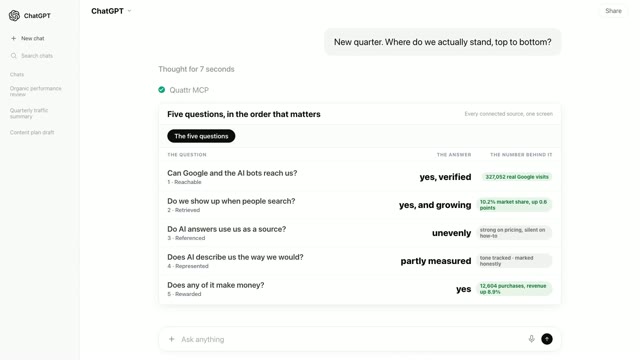 2 min 20 secWhere do we stand? Five questions answer it, in order.Search Console + Rank tracking + AI visibility · Monthly exec review◐Recreated from an anonymized session
Related metrics and workflows
Verification
A definition is the smallest part of this.
The measurement matters because something acts on it. Here is the rest of the showcase, in the order most people find useful.