
Conversion rate
also called CVR
Definition
The share of visitors who converted against your configured goals in the period.
How it's calculated
Conversions divided by users, with a null guard on the denominator: `1.0 * conversions / NULLIF(users, 0)`. The denominator is not a sum, users is an approximate distinct count, a HyperLogLog estimate over the per-row visitor sketches with nulls read as zero, so the rate is conversions per estimated distinct person.
- Numerator
- Conversions against configured goals over the period
- Denominator
- Distinct users over the period, as a sketch-based approximate distinct count rather than a summed column
Scope, grain and dimensions
- Grain
- One number per date range, or one row per breakdown value.
- Dimensions
- country · device · page · keyword · source_medium · intent · category
- Required filters
- date_range
- Aggregation
- A ratio, recomputed at the queried grain. Averaging per-page rates does not reproduce the site rate.
- Metric type
- rate · fraction of users (stored 0 to 1, shown as a percent)
Data sources
Where you'll see this
Named reports that normally include this metric.
AI referral traffic reportContent performance reportMonthly executive search reportSearch to revenue report
Skills and analyses that use it
Skills carry the judgment; the analysis verbs do the reading.
Analysis verbs
web_analytics_overviewconversions_overviewpop_significance
Method rungs and levers
A rung tells you what a movement here can and cannot explain, read the rungs below it first.
Ask Quattr
- "What is our conversion rate?" Simulate this →
- "Did conversion rate really change versus last month?" Simulate this →
How to read it
The efficiency half of the outcome story, measured entirely inside the analytics source. It is stored as a fraction and displayed as a percent, so a value of 0.021 is 2.1%. Because the denominator is an estimated distinct user count rather than sessions, it answers what share of PEOPLE converted, not what share of visits did, and because the numerator counts conversion EVENTS rather than converted users, the two sides are not a matched proportion and the ratio is not a per-person probability.
Caveats, freshness and failure modes
Never derive this from a conversion count and a click count. Conversion rate comes from the analytics source; dividing one system's numerator by another system's denominator produces a number that is wrong in a way nobody can see.
The numerator counts conversion EVENTS, not converted users, while the denominator is an estimated distinct user count. The two are not a matched proportion, which is why the significance tool tests the displayed rate's own movement instead of modelling it as successes over trials.
There is no session-denominator construction anywhere in the product. Every tool reads the displayed measure, conversions over estimated users, or the analytics source's own averaged per-row rate on non-enterprise accounts, and the code explicitly refuses to reconstruct a rate over sessions or clicks.
On accounts below the enterprise analytics tier the tool swaps to a differently constructed twin: an average of a per-row rate column rather than a ratio of two totals. That is a different definition, not just a different source, and it is not reconstructible from aggregate counts at all.
Stored as a fraction between 0 and 1; a consumer that multiplies by a hundred twice will report a rate a hundred times too high.
Whole-domain only today.
- Freshness
- loads nightly, a same-day question gets yesterday's number, labelled as yesterday's.
Common failure modes
- Computing conversions divided by clicks and presenting it as conversion rate.
- Assuming the rate is conversions over sessions because that is the industry default, the denominator is an estimated distinct user count.
- Averaging per-page conversion rates into a site rate.
Not the same as
The confusions that cause the most wrong decisions.
Conversion rate Conversions Compare definitions →
The rate is its own measure with its own denominator and is never derived from the count. The code says so explicitly, and the two answer different questions: how many, versus what share.
Conversion rate Conversion-rate change Compare definitions →
One is a level for a period; the other is the difference between two periods, carried on a different scale.
Conversion rate Cost per conversion Compare definitions →
Cost per conversion is a price from the ad platform's attribution; conversion rate is a rate measured in the analytics source against your own named goals. They come from different systems and are never combined.
Conversion rate Funnel drop-off rate Compare definitions →
Conversion rate is a single measured rate over users for the whole period; a funnel drop-off is the relative decline between two chosen aggregate counts. The end-to-end product of the drop-offs will not equal the conversion-rate measure.
Watch this metric read in a real run
All runs → 3 min 4 secThe fix shipped. Traffic rose. Now two teams want the credit.Lighthouse + Search Console + Rank tracking · Significance referee · Cross domain correlator◐Recreated from an anonymized session
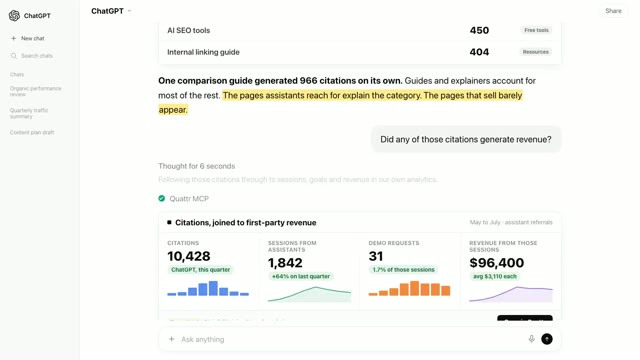 1 min 55 secChatGPT cites us. Does any of it become revenue?AI visibility + Web analytics · Search to revenue◐Recreated from an anonymized session
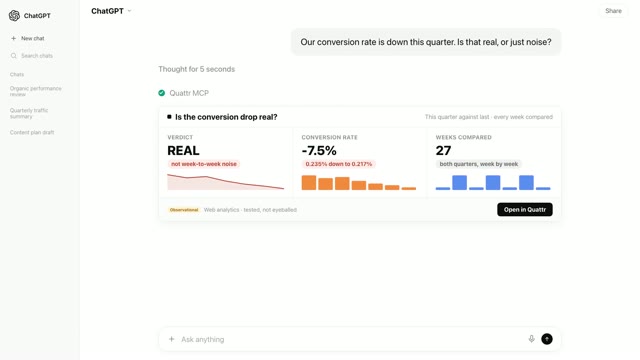 2 min 26 secConversion rate fell 7.5%. The number is real. The panic is not.Web analytics · Significance referee◐Recreated from an anonymized session
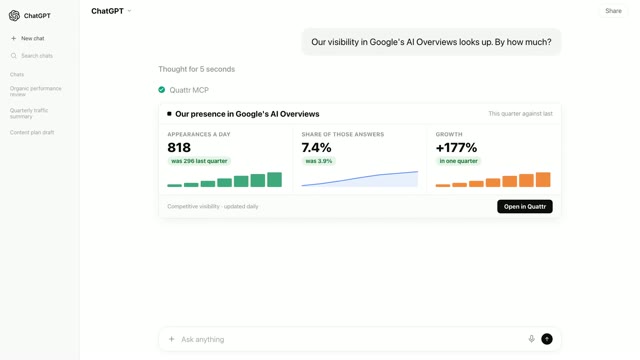 2 min 2 secSomething went right this quarter. Now prove it before you say it out loud.Rank tracking + Search Console · SERP feature watch · Significance referee◐Recreated from an anonymized session
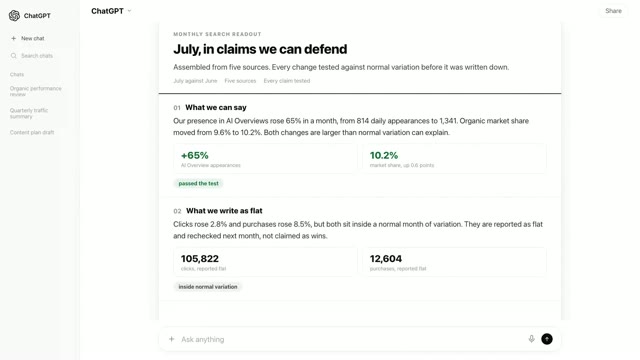 2 min 18 secThe deck is due tomorrow. The numbers live in five places.Search Console + Rank tracking + AI visibility + Web analytics + Google Ads · Monthly exec review◐Recreated from an anonymized session
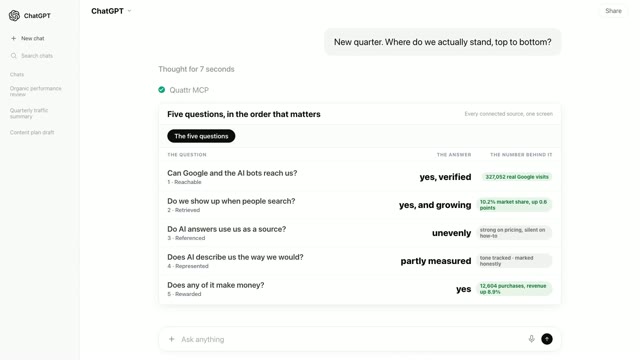 2 min 20 secWhere do we stand? Five questions answer it, in order.Search Console + Rank tracking + AI visibility · Monthly exec review◐Recreated from an anonymized session
Related metrics and workflows
Verification
A definition is the smallest part of this.
The measurement matters because something acts on it. Here is the rest of the showcase, in the order most people find useful.