
CTR delta versus the curve
also called Expectation gapCTR over/under-performance
Definition
How far a keyword-and-page row's actual click-through rate sits above or below what this site's own fitted curve expects at that row's position.
How it's calculated
deltaCtr = actualCtr − expectedCtr, where the expectation comes from the fitted curve for that row's own branded × intent × device cell, evaluated at the row's average position. Rounded to four decimals.
Scope, grain and dimensions
- Grain
- One keyword × one page × the window.
- Dimensions
- query · page · brand · intent · device · position
- Required filters
- date range
- Aggregation
- Row-level. A cell-level or site-level expectation gap would need both sides re-pooled, not the deltas averaged.
- Metric type
- derived metric · CTR points as a 0 to 1 fraction (positive means over-performing)
Data sources
Where you'll see this
Named reports that normally include this metric.
Content decay reportCTR opportunity report
Skills and analyses that use it
Skills carry the judgment; the analysis verbs do the reading.
Analysis verbs
ctr_curve_model
Method rungs and levers
A rung tells you what a movement here can and cannot explain, read the rungs below it first.
levers L3 Refresh & content quality
Ask Quattr
- "Which pages earn fewer clicks than their position deserves?" Simulate this →
- "Where are we over-performing our own CTR curve?" Simulate this →
- "Which titles should we rewrite first?" Simulate this →
How to read it
Both tails are useful and they are used differently: the negative tail is a rewrite worklist, the positive tail is a set of patterns worth copying. Either way it is a hypothesis about the snippet, and a rewrite is measured at day 7, 14 and 30 rather than credited on the spot.
Caveats, freshness and failure modes
A negative gap is a candidate, not a diagnosis: mixed intent inside one query, a blended position, and results-page features all move it without the snippet being at fault.
Rows whose position bucket is flagged low-confidence have an unreliable expectation, so their gap is unreliable too.
When the row's exact cell had no fit, the gap is measured against a substituted curve and the substitution is reported on the row.
- Freshness
- 1 to 2 days behind, Google's own reporting lag. Any answer touching the last 48 hours says so on the card.
Common failure modes
- Treating the under-performer list as a set of copywriting failures rather than as candidates to test.
- Ranking the worklist by gap size and filling it with tiny-impression rows, that is what the impact figure is for.
Watch this metric read in a real run
All runs →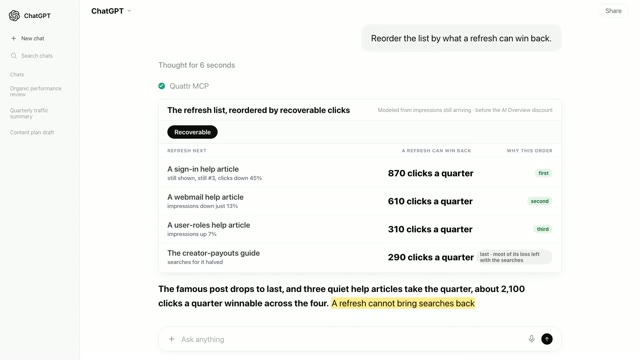
Related metrics and workflows
Verification
A definition is the smallest part of this.
The measurement matters because something acts on it. Here is the rest of the showcase, in the order most people find useful.