
Content decay report
also called Content refresh reportDeclining pages reportRefresh worklistContent lifecycle report
Pages measured against their own peak rather than against the site average: how far each has slid, over what period, and how many clicks are plausibly recoverable if it is refreshed. Each entry carries a recommendation, refresh, consolidate or leave, so the output is a work queue rather than a list of declines. Seasonality is separated from decay before anything reaches the list.
Who it is for, and what it settles
- Audience
- Content lead
- Job to be done
- Produce a refresh-or-consolidate worklist ordered by recoverable clicks, not by how old the page is.
- Cadence
- Quarterly
The metrics, in three tiers
Headline numbers carry the story. Diagnostics explain a headline that moved. Guardrails stop a wrong conclusion. Every row links to the definition, the formula, the caveats and what the metric is not all live on the metric page.
Headline What you lead with 4
Diagnostic Reached for when a headline moves 7
- Period-over-period change, relative derived metric relative change
- Average position rank results-page position
- Organic impressions raw measure impressions
- Average CTR derived metric percent
- CTR delta versus the curve derived metric CTR points as a 0 to 1 fraction
- Potential clicks, AI-Overview-adjusted derived metric clicks over the window
- Ranking movement (gainers and losers) derived metric keywords classified as gainers, losers or flat
Guardrail Stops the wrong conclusion 4
Required data sources
Skills that produce or interpret it
Method rungs covered
- R1 Reachable , not covered
- R2 Retrieved , covered
- R3 Referenced , not covered
- R4 Represented , not covered
- R5 Rewarded , covered
It reads the upper rungs only. If a lower rung is broken, fix that before you present this, a report that never checks whether pages can be reached will keep reporting movement that may not be yours.
Ask for it in one sentence
The prompt pack for this report, copy one, or watch it play in the simulator.
- "Which pages have decayed since their peak?" Simulate this → Prompt gallery →
- "What should we refresh next quarter?" Simulate this → Prompt gallery →
- "How many clicks could a refresh recover?" Simulate this → Prompt gallery →
- "Is this decline decay or seasonality?" Simulate this → Prompt gallery →
What to say out loud when you present it
A decline against peak is not decay if the peak was a seasonal high or a one-off event, compare year over year before adding a page to the list. Recoverable-click estimates assume the page can return to a prior position and are a planning aid, not a forecast. Pages that declined because a rival page of yours now ranks for the same query belong in the cannibalisation report instead.
Related workflows and use cases
Watch a run that builds this report
All runs →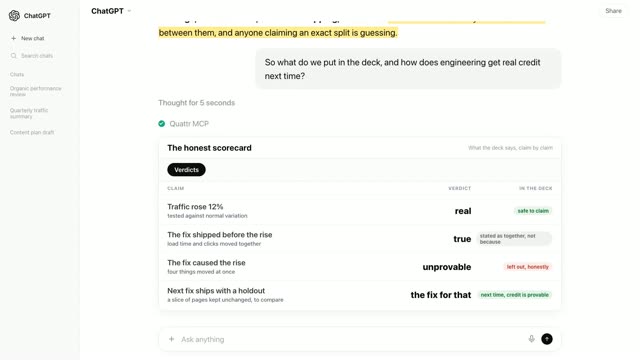 3 min 4 secThe fix shipped. Traffic rose. Now two teams want the credit.Lighthouse + Search Console + Rank tracking · Significance referee · Cross domain correlator◐Recreated from an anonymized session
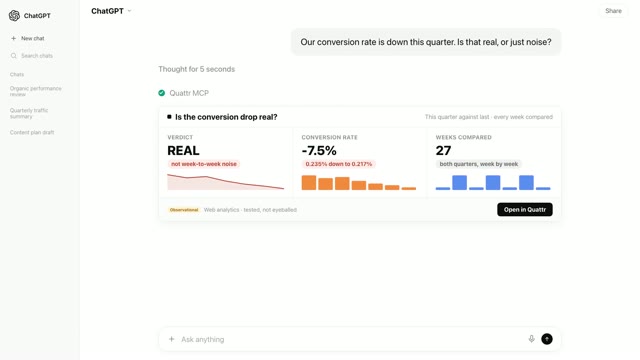 2 min 26 secConversion rate fell 7.5%. The number is real. The panic is not.Web analytics · Significance referee◐Recreated from an anonymized session
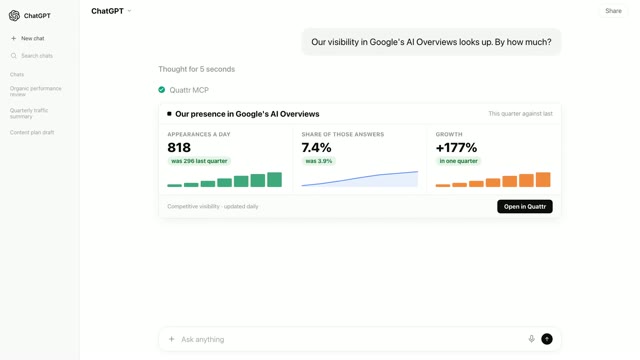 2 min 2 secSomething went right this quarter. Now prove it before you say it out loud.Rank tracking + Search Console · SERP feature watch · Significance referee◐Recreated from an anonymized session
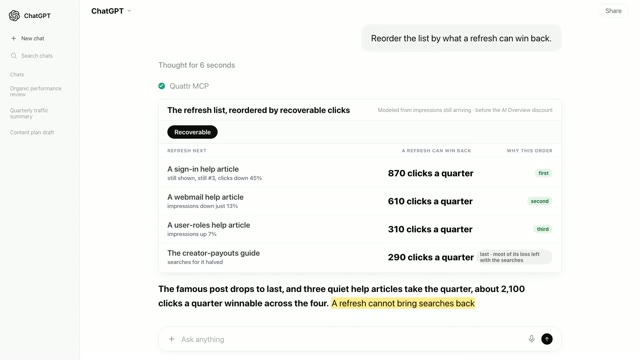 2 min 23 secYour biggest loser is not your best refresh.Search Console · Content decay refresh◐Recreated from an anonymized session
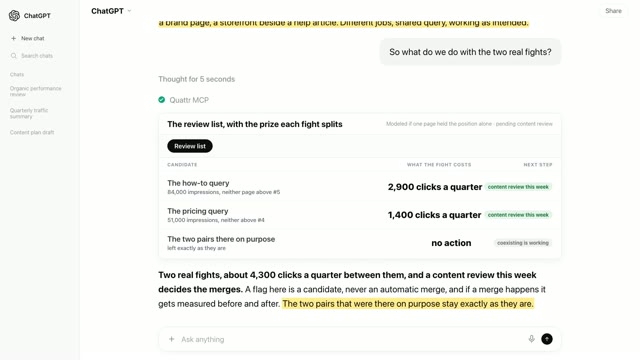 2 min 19 secOn some queries, your toughest rival is your own other page.Search Console + Rank tracking · Cannibalization check◐Recreated from an anonymized session
How this entry was verified
Knowing the contents is step one.
Someone still has to assemble it, defend the numbers and present it. Here is the rest of the showcase.